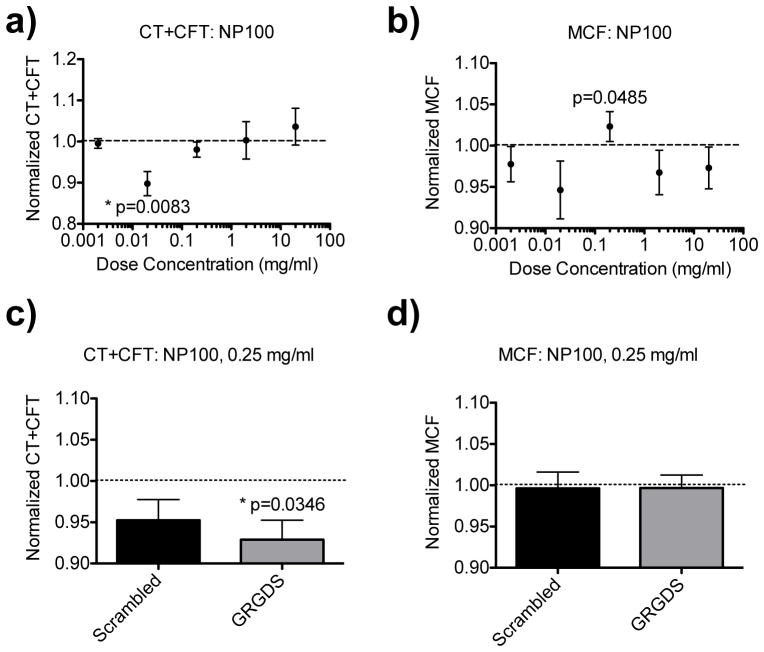
Figure 3.
IN VITRO DOSE RESPONSE GRGDS-NP100. a–b) Total clotting time (CT+CFT) and maximum clot firmness (MCF) dose-responses, recapitulated the in vivo response observed: high doses adversely impact clotting parameters (increase CT+CFT; decrease MCF). This is observed until dosing down to 0.02–0.2 mg/ml. C–D) 0.25 mg/ml was then further tested directly against a scrambled-NP100 control (n=6). CT+CFT was reduced compared to saline (p=0.0346), with no significant impact on MCF. Dotted lines denote normalization to the saline-treated controls values. Error bars denote SEM.

