
Fig. 5.
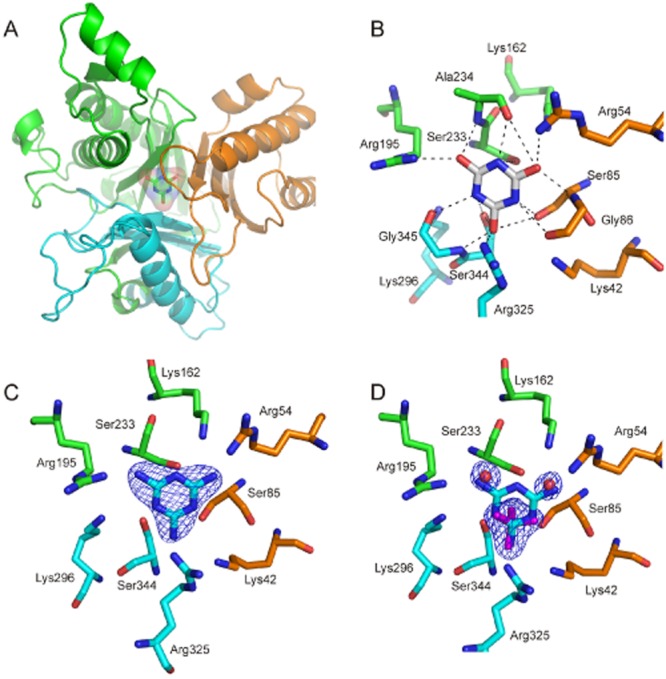
The active site of AtzD.
A. The cyanuric acid-bound monomer showing the Toblerone fold (cartoon with RUs coloured as in Fig. 2A) with the substrate bound in the active site (stick and surface).
B. Active site of AtzD with cyanuric acid bound. Hydrogen bonds are shown (dashed lines).
C. The AtzD active site with bound melamine.
D. Electron density for the inhibitor is shown.
Density for the phosphate (magenta) and two water molecules (red balls) in the ‘native’ data set with the melamine bound AtzD structure superposed.