
Fig. 7.
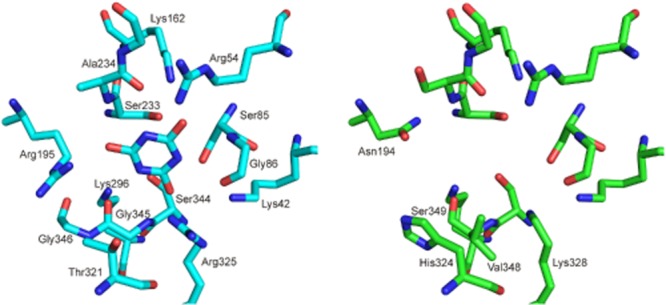
Comparison of the active sites of AtzD and a homology model of Bar. The AtzD active site is shown (left, cyan) with cyanuric acid bound. The modelled Bar active site (right, green) is shown without cyanuric acid docked, only the amino acid residues that differ between AtzD and Bar are indicated on the Bar structure.