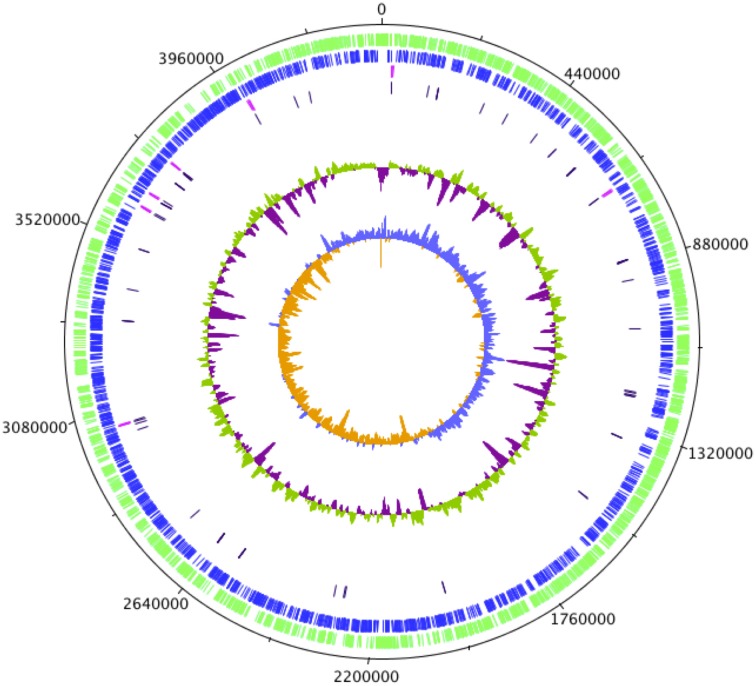
Figure A1.
Circular representation of the C. sakazakii SP291 genome. The first circle represents the scale in kilobases starting with the origin of replication at position 0. The second circle shows the distribution of CDS (Goldman and Green, 2009) in forward strand. The third circle indicates the distribution of CDS (blue) in reverse strand. rRNA operons are colored in red on the fourth circle. tRNA operons are colored in purple on the fifth circle. The sixth circle indicates the deviation of the GC content average, with values greater than zero in green and those less than zero in purple. The innermost circle displays the GC skew ([G + C]/[G − C]), with values greater than zero in light blue and those less than zero in orange. The figure was generated using DNAPlotter (Carver et al., 2009).

