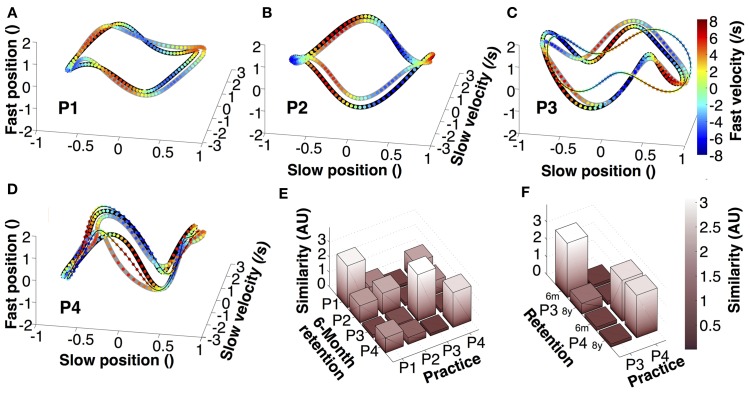
Figure 7.
Average trajectories in four-dimensional state space. (A–D) Representation of average trajectories for each participant during the last practice session (thick black lines), 6-month retention (thick gray lines), and 8-year retention session (thin black lines). (E,F) Similarity between the trials of the last session, the 6-month retention trials and the 8-year retention trials of participants 3 and 4.

