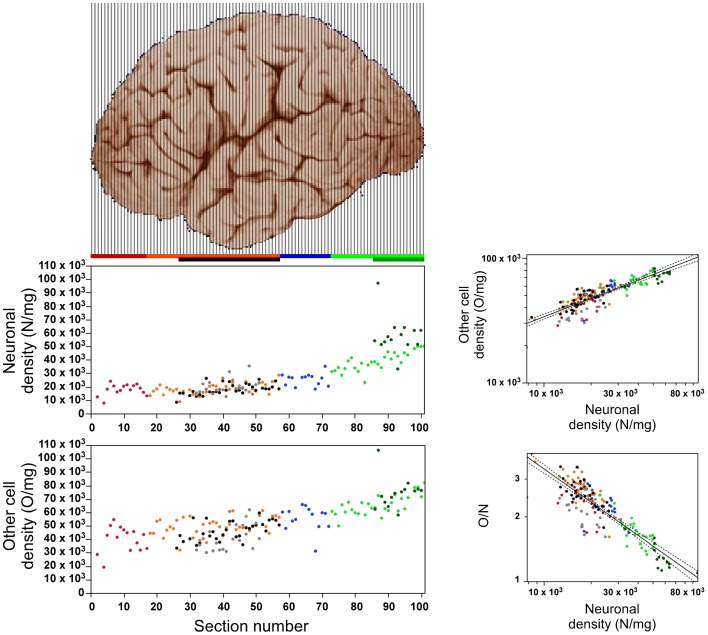
Figure 4.
Relationship between local variations in neuronal density and in other cell density. Left, neuronal (top) and other cell densities (bottom) increase along the anteroposterior axis along the posterior half of the cerebral cortex (anterior is to the left). Right, top: Density of other cell density varies across all sections as a power function of neuronal density with exponent 0.485 ± 0.024 (p < 0.0001). Exponents within each region: prefrontal, 0.784 ± 0.151 (p < 0.0002); dorsal, 0.467 ± 0.068 (p < 0.0001); “parietal,” 0.762 ± 0.202 (p = 0.0027); “occipital,” 0.378 ± 0.092 (p = 0.0003); temporal, 0.498 ± 0.078 (p < 0.0001); insula, 0.700 ± 0.126 (p < 0.0001); V1, 0.514 ± 0.107 (p = 0.0004). Right, bottom: The O/N ratio varies across all sections as a power function of neuronal density with expoent −0.515 ± 0.024 (p < 0.0001). Data points are color-coded as before: prefrontal (red), dorsal (orange), “parietal” (blue), “occipital” (light green), temporal (black), insula (gray) and V1 (dark green). Power laws and 95% confidence intervals are plotted for the entire dataset.

