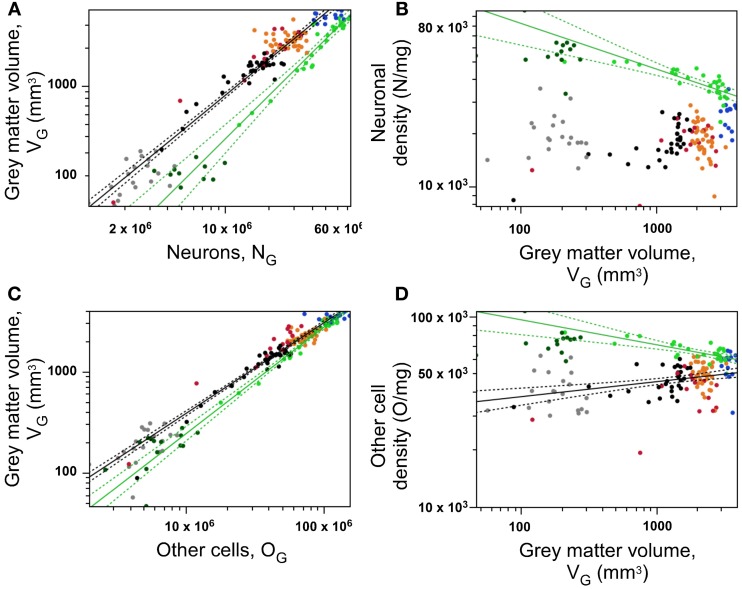
Figure 6.
Neurons are distributed differently across occipital and non-occipital cortical zones, but similarly within each zone. (A) Gray matter volume within each section varies as a shared function of the number of neurons in the section within occipital cortex (light green points) and across non-occipital areas (all other points). (B) Neuronal density decreases significantly with increasing gray matter volume across coronal sections within occipital cortex (green), but not across non-occipital areas. (C), Gray matter volume within each section varies as a shared function of the number of other cells in the section within occipital cortex (light green points) and across non-occipital areas (all other points). (D) density of other cells decreases significanty with increasing gray matter volume across sections within occipital cortex (green), and increases across sections of non-occipital cortex (other colors). Data points are color-coded as before: prefrontal (red), dorsal (orange), “parietal” (blue), “occipital” (light green), temporal (black), insula (gray) and V1 (dark green). V1 values are contained in the corresponding “occipital” data points and V1 data points are not included in the fits. The fitted power functions, where significant, are shown separately for each cortical zone (occipital in green, and non-occipital in black), with 95% confidence intervals shown as dashed lines.

