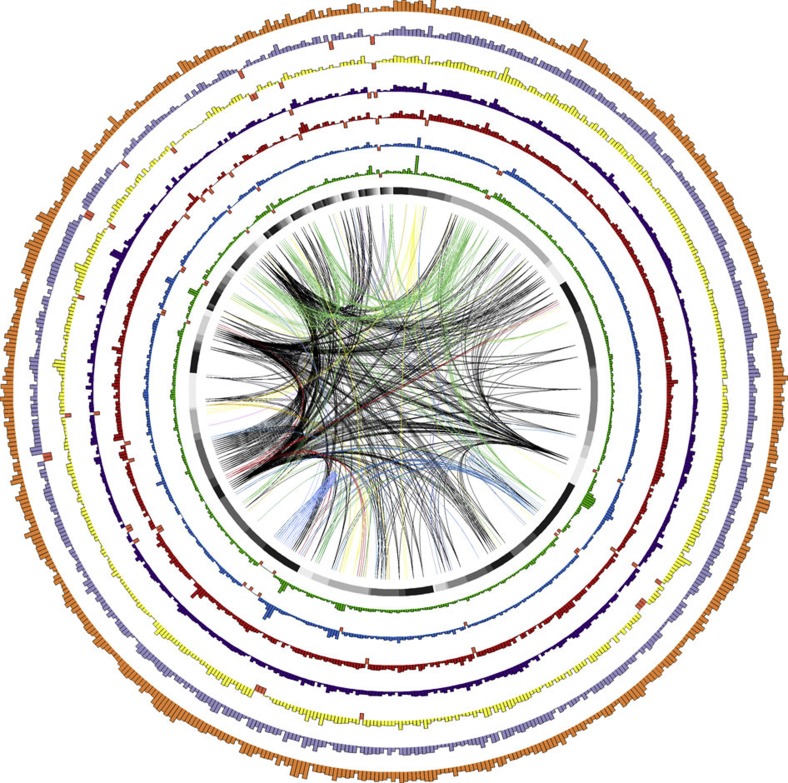
Figure 2. Visualization of sequencing coverage distribution across all reference RXLR effectors.
Bar heights represent the mean-normalized coverage of 583 reference RXLR effector genes in the resequenced genome of a particular sample. Genes are arranged according to their 5′ to 3′ physical position on the T30-4 reference genome assembly supercontigs. The black section at the top of the inner ring represents the eight RXLRs contained on supercontig 1. RXLRs in supercontigs 2, 3, … 4802 follow in clockwise fashion, each represented by a different shade of grey. Historical samples Pi1845A (green) and Pi1889 (blue) are plotted along the two inner rings. The resequenced reference strain T30-4 (orange) is plotted in the outer ring, while the remaining inner rings represent modern isolates IN2009T1 (US-22; red), BL2009P4 (US-23; purple), RS2009P1 (US-8; yellow) and 06_3928A (13_A2; light purple). Orange bars extending below the axis indicate genes undetected in a particular sample (Supplementary Table S3). The central links connect a gene absent in at least one resequenced genome to all other members of its tribe, with a unique colour for each tribe.

