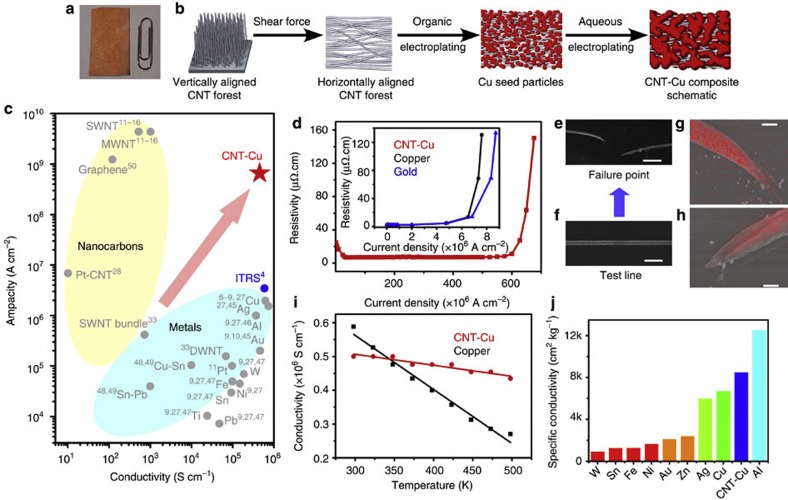
Figure 1. Fabrication and ampacity of CNT–Cu composite.
(a) Picture of CNT–Cu composite alongside a paperclip for size reference. (b) Schematic representation of various steps for CNT–Cu composite fabrication. Cu seeds nucleate on the CNT surface during the organic electrodeposition and subsequently grow during the aqueous electrodeposition to yield the CNT–Cu composite. (c) Ashby plot of ampacity versus conductivity for various relevant materials, including metals (such as Cu, Au, Ag, Al, etc), alloys (such as Sn-Pb), nanocarbons (such as SWNT, graphene) and composites (such as Pt–CNT). The ITRS recommended level of current density is also shown for comparison, with the performance of CNT–Cu exceeding it. (d) Variation of resistivity with current density for CNT–Cu composite. The electrical conductivity of the wire was 2 × 10⁵ S cm−1. Similar traces for Cu and Au lines are shown in inset for comparison. (e) SEM image of CNT–Cu test structure after failure. Scale bar, 4 μm. (f) SEM image of the same CNT–Cu composite test line before failure. Scale bar, 4 μm. (g,h) EDX mapping (based on Cu) of the failure points of CNT–Cu composite line presented in Fig. 1e. Scale bar, 500 nm. (i) Variation of conductivity with temperature for CNT–Cu (red) and Cu (black), showing the largely invariant conductivity of CNT–Cu composite with temperature. In comparison, Cu shows a decreasing conductivity with temperature, as expected for metals. (j) Comparison of conductivity per unit weight (specific conductivity) of CNT–Cu with different metals.

