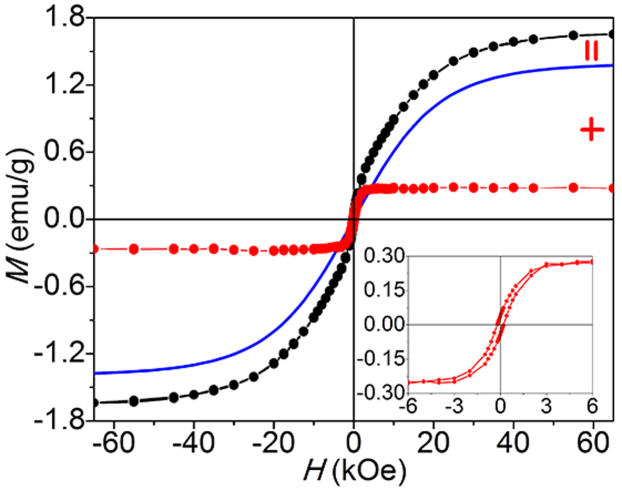
Figure 4. Analysis of the 2 K M − H curve of NGO.
Black curve is the measured curve, and blue line is the fitting curve for paramagnetism by the Brillouin function with g = 2 and J = 1.11. Red curve is ferromagnetic mass magnetization by subtracting the paramagnetism from the measured curve. Inset is a part of the ferromagnetic mass magnetization.

