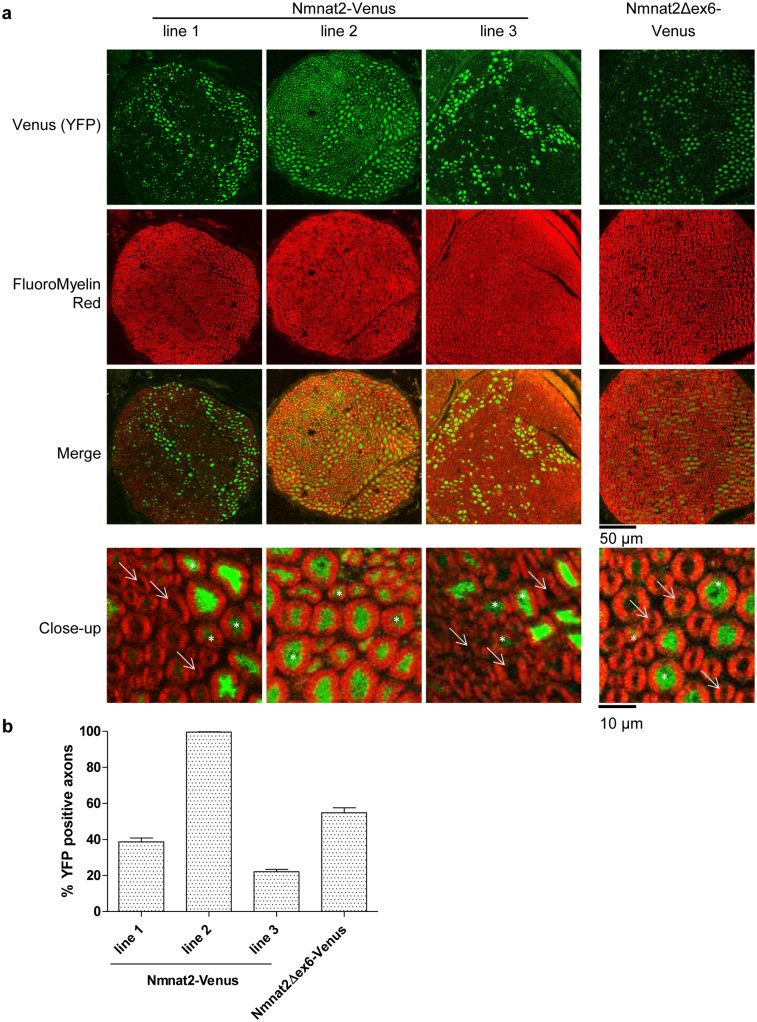
Figure 1. Characterisation of transgene expression in Nmnat2-Venus and Nmnat2Δex6-Venus mouse lines.
(a) Cryostat cross-sections (20 μm thickness) of sciatic nerves of Nmnat2-Venus and Nmnat2Δex6-Venus mice. YFP fluorescence from transgene expression is shown in green and FluoroMyelin staining is shown in red. In close-up images, white arrows indicate axons that were scored negative for transgene expression and white asterisks indicate axons that were scored positive (note that in line 2 images, virtually no axons were found to be negative for transgene expression). (b) Quantification of the percentage of total axons (identified by FluoroMyelin staining) that showed detectable (above-background) YFP expression in Nmnat2-Venus and Nmnat2Δex6-Venus mouse sciatic nerves (see Methods). Error bars indicate SEM.

