
Figure 4. Micrographs of I3D nanofibrils and the Pt NP assemblies produced in comparative experiments.
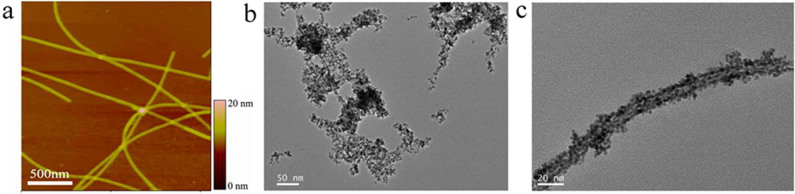
(a) AFM image of I3D nanofibrils formed at 4 mM in water after one-week incubation at pH of 7. (b) TEM image of Pt NP aggregates synthesized by reducing K2PtCl4 in the presence of 2 mM I3D and 1 mM P7A after reaction for 24 hr. (c) TEM image of 1D continuous Pt NP assemblies produced by reducing K2PtCl6 in the presence of 2 mM I3K but without P7A after 24 hr reaction.