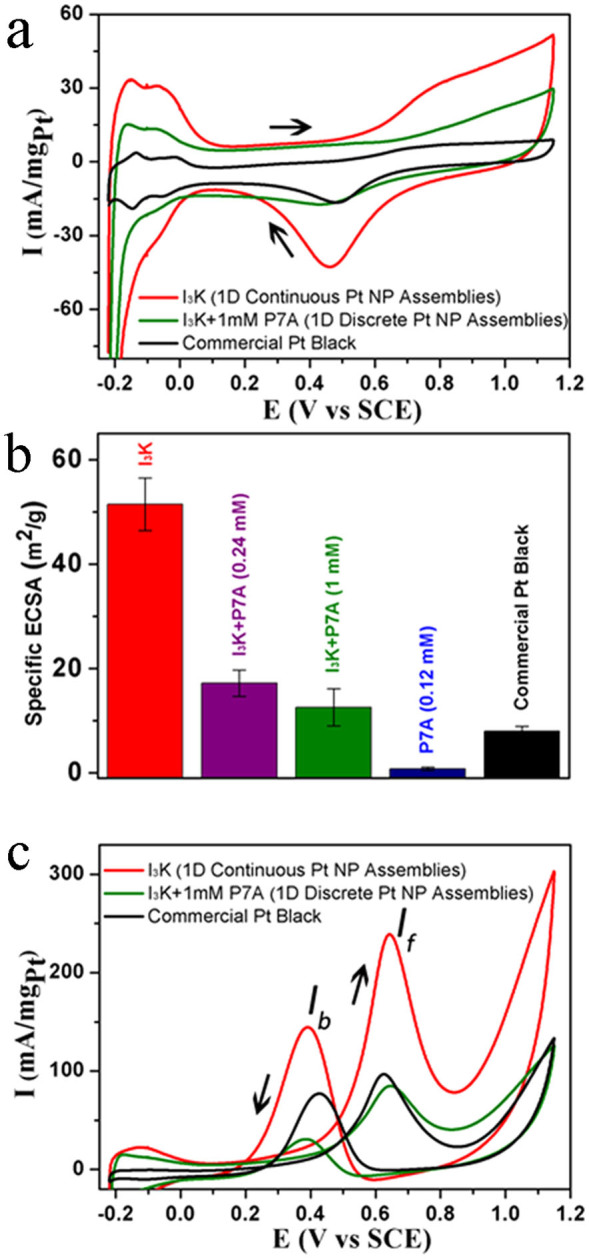
Figure 5. Comparison of electrocatalytic properties of different Pt nanostructures.

(a) CV curves in a N2-saturated 0.5 M H2SO4 solution with a sweep rate of 50 mV s−1; the indicated Pt nanostructures include 1D continuous Pt NP assemblies synthesized in the presence of only I3K (denoted as “I3K”), 1D discrete Pt NP assemblies synthesized in the presence of 2 mM I3K and 1 mM P7A (denoted as “I3K + 1mM P7A”) and commercial Pt black. (b) Specific ECSAs; note that in this case, specific ECSAs of the 1D Pt NP nanostructure produced in the presence of 2 mM I3K and 0.24 mM P7A and the isolated Pt NPs in the presence of 0.12 mM P7A are also given for comparison. (c) CV curves in a N2-saturated 0.5 M H2SO4 solution containing 1 M methanol.
