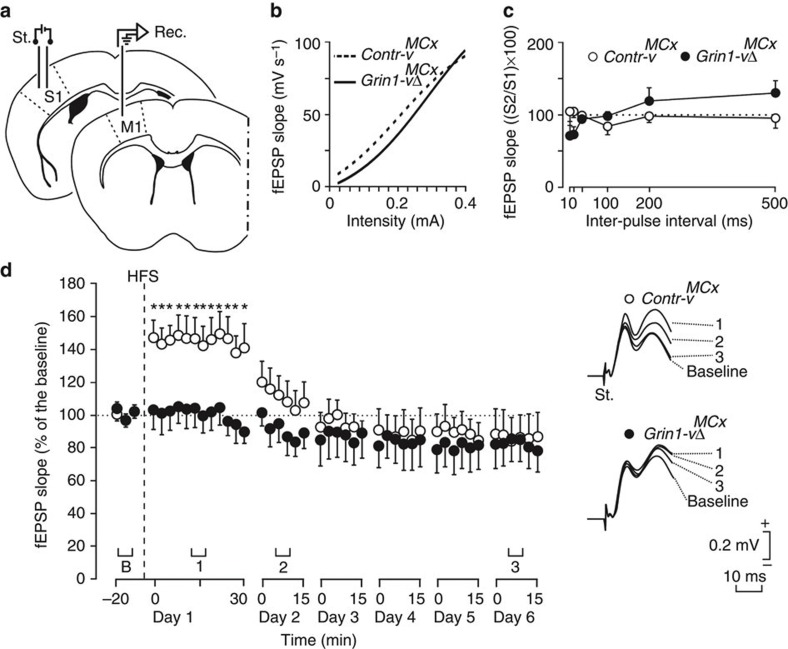
Figure 2. Paired-pulse facilitation and long-term potentiation induction.
(a) Schematic depicting electrode implanted in vivo for stimulating neurons in the S1 and recording in M1. (b) Input/output curves for the S1-primary motor cortex synapse. A single pulse was presented to S1 at increasing intensities (in mA), while recording the evoked fEPSP at the motor cortex for Contr-vMCx (white circle and dashed line) and Grin1-vΔMCx (black circle and continuous line) mice. The best sigmoid adjustment to the collected data is represented (r>0.92; P≤0.001; non-linear regression analysis). There were no significant differences between groups (n=10 per group; P=0.145; F(1,19,18)=2.310; two-way ANOVA). (c) Responses to paired-pulse stimulation. The data shown are mean±s.e.m. slopes of the second fEPSP expressed as a percentage of the first for six (10, 20, 40, 100, 200 and 500) interstimulus intervals. The two groups (n=5 per group) of mice presented a similar (P=0.185; F(5,54,48)=1.577; two-way ANOVA) paired-pulse facilitation at intervals of 20–100 ms. (d) At the top are illustrated examples of fEPSPs collected from selected Contr-vMCx (white circles) and Grin1-ΔMCx (black circles) mice (n=10 per group) before (B, baseline) and after HFS of Schaffer collaterals. The bottom graphs illustrate the time course of LTP evoked in the motor cortex (fEPSP mean±s.e.m.) following HFS for Contr-vMCx and Grin1-vΔMCx mice. The HFS was presented after 15 min of baseline recordings, at the time indicated by the dashed line. The fEPSP is given as a percentage of the baseline (100%) slope. Grin1-vΔMCx mice have no LTP. In addition, values collected from the Contr-vMCx group were significantly (*P<0.01; F(6,54,63)=11.915; two-way ANOVA) larger than those collected from Grin1-vΔMCx mice.

