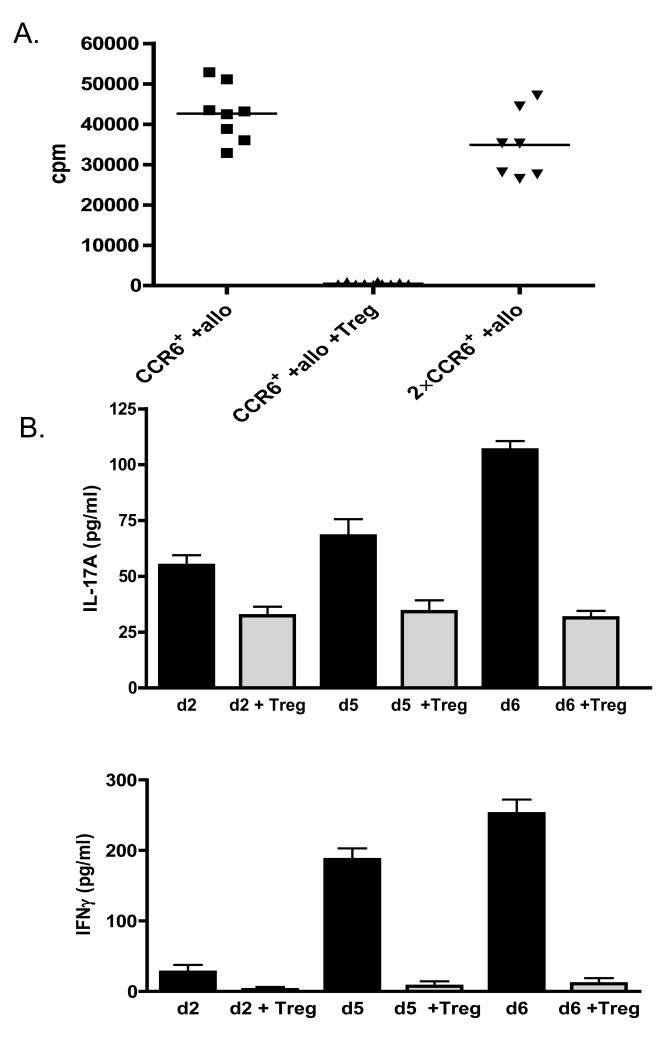
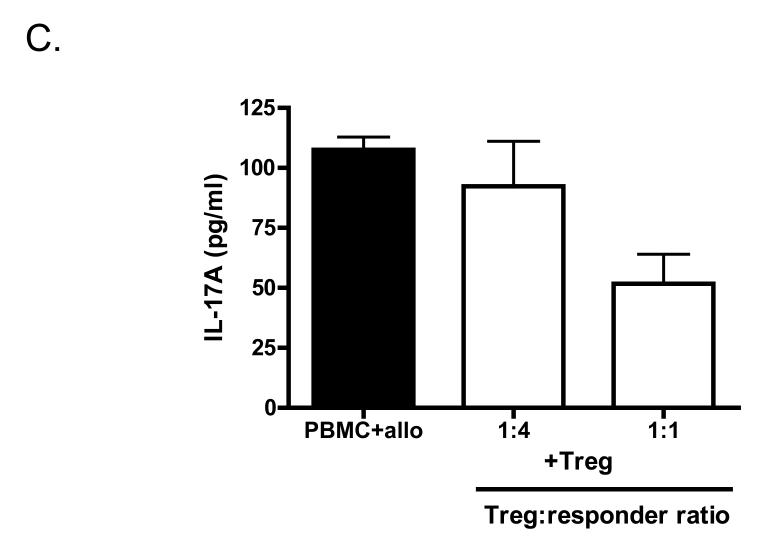
Figure 5.
CCR6+CD4+ T cell proliferation and cytokine production is controlled by Treg cells. (A) Expanded CCR6+CD4+ T cells were stimulated with irradiated allogeneic PBMC and incubated with or without expanded Treg cells at a 1:1 ratio. Double the number of allo-stimulated CCR6+CD4+ T cells (2×CCR6+) served as a control. Cells were incubated for 7 days, 3H-Thymidine was added for the last 16-18h of the culture. Results are depicted as counts per minute (cpm). (B) Measurement of supernatant levels of IL-17A and IFNγ taken on day 2, 5 and 6 of allo-stimulated expanded CCR6+CD4+ T cells cultured in absence or presence of expanded Treg cells at a 1:1 ratio. (C) IL-17A levels in supernatants from PBMC stimulated with irradiated allogeneic PBMC cultured in absence or presence of expanded Treg cells in 1:1 and 1:4 Treg:responder ratio.


