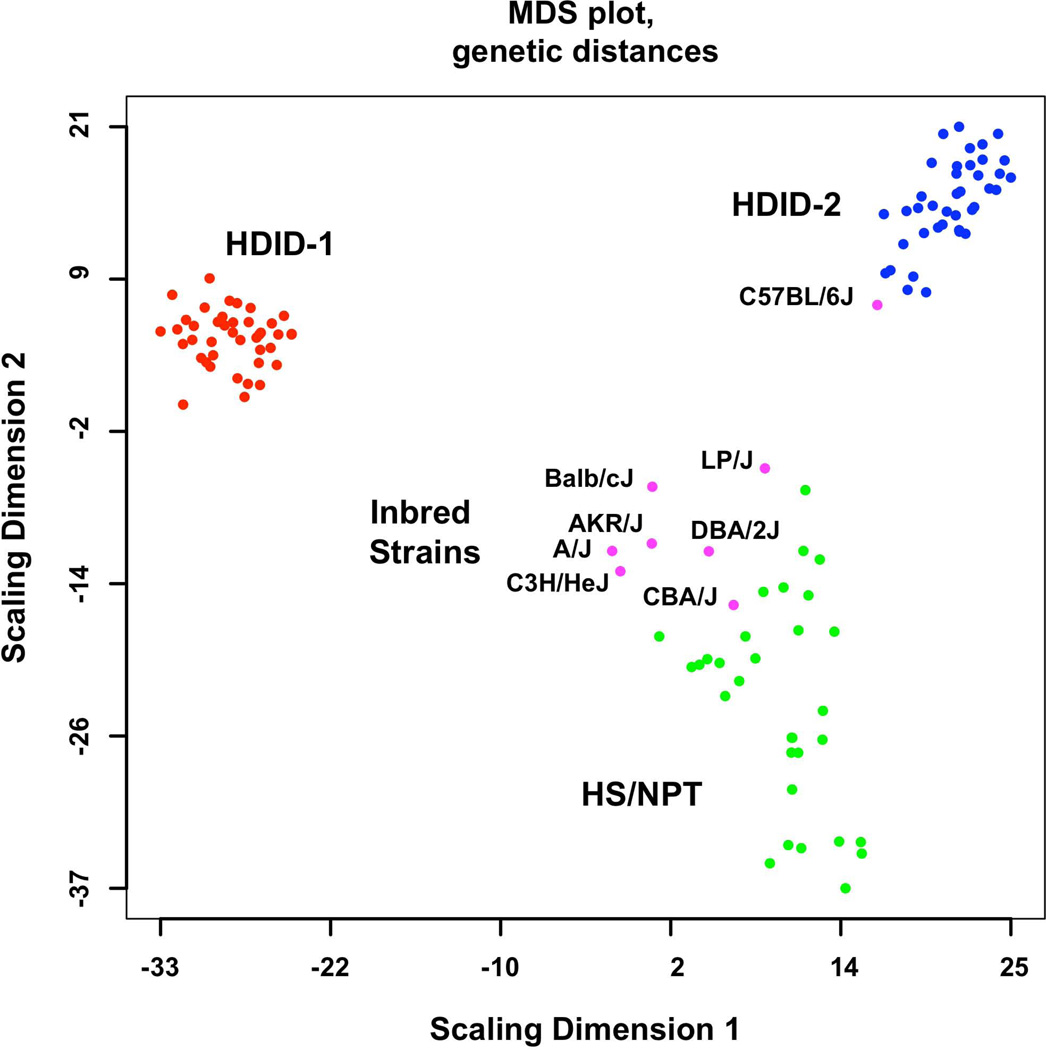
Figure 1.
Genome-wide genetic distances between the HDID-1 and -2 selected lines, HS/NPT animals and the inbred strains used to form the HS/NPT. Details of the animals used are found in the Methods. Data are presented as a multidimensional scaling (MDS) plot. Note the greater dispersion in the HS/NPT animals when compared to the HDID-1 and HDID-2 selected lines and the differences between the two selected lines. Also note that among the inbred strains the C57BL/6J is distinct from the other 7 founders.

