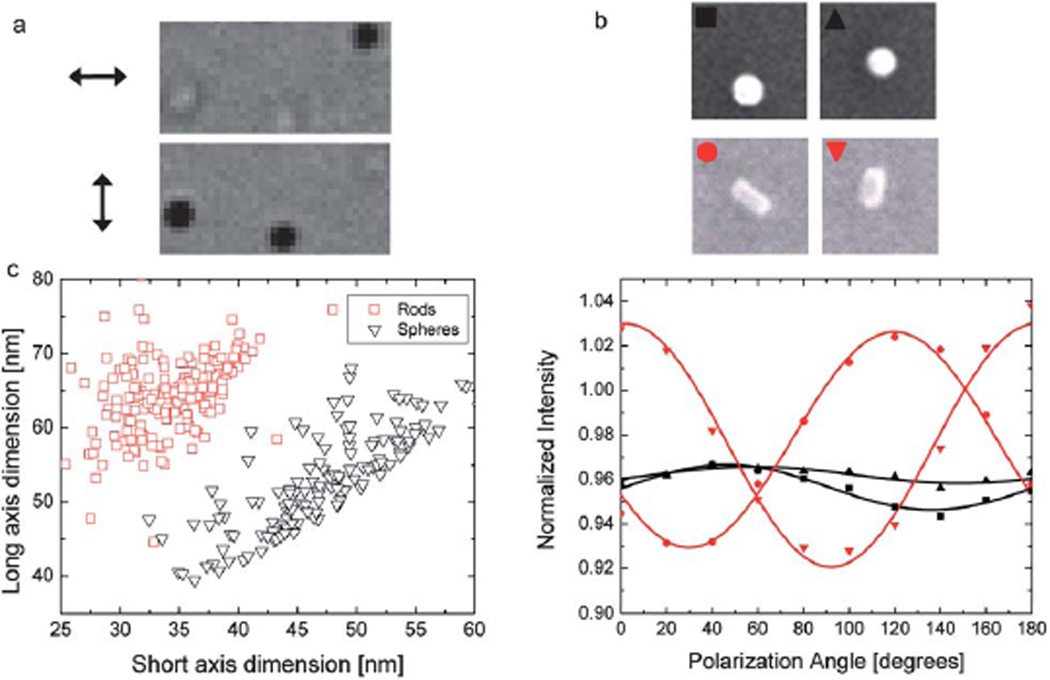
Fig. 4.
Morphology measurement of nanoparticles using IRIS. (a) Optical image of three gold nanorods (nominally 30 nm by 70 nm) for two orthogonal polarization of incident light. (Arrows show the polarization of the incident light.) (b) Comparison of IRIS and SEM measurements for two gold nanospheres (nominally, d = 46 nm) and two nanorods (nominally, 30 nm by 70 nm). The data points and the solid curves show the experimental values and numerical fit to data points for dimension analysis, respectively. (c) High-throughput analysis of nanorod and nanosphere populations on a scatter chart.

