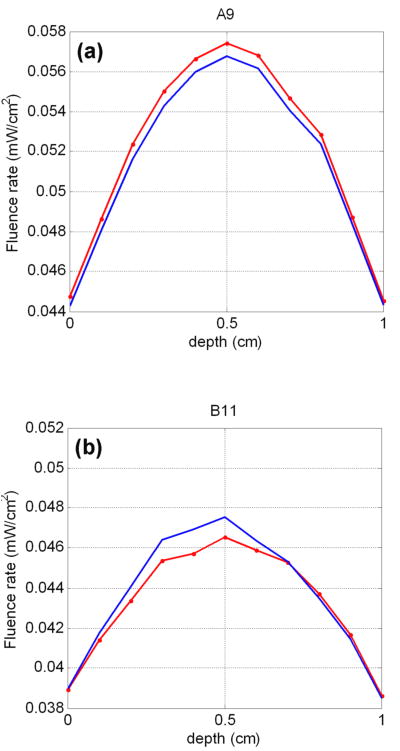
Figure 12.
Comparison between measured (dotted red lines) and reconstructed (blue lines) light fluence rate on far CDF-detector pairs for the DOT reconstruction on the mathematical phantom. A9 and B11 denote the CDF-detection pairs as shown in Figure 1a.

