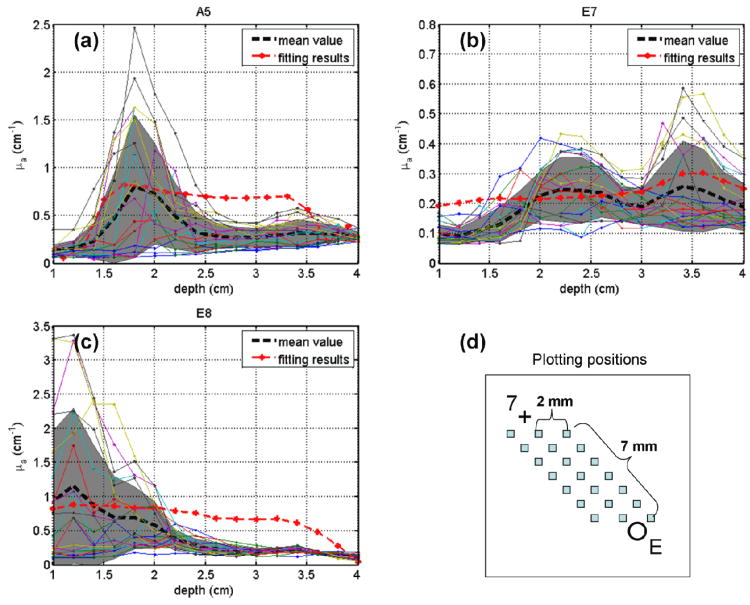
Figure 14.
Comparison of absorption coefficient results over depth between interstitial DOT and CDF fitting program for CDF-detector pairs (a) A5, (b) E7, and (c) E8. Red dotted curves represent CDF fitting results. Dashed black curves and gray shadows represent mean values and standard deviation of absorption coefficient over depth (shown by solid color lines), respectively. (d) The locations where the absorption coefficient values were reconstructed by interstitial DOT for CDF-detector pair E7 as an example.

