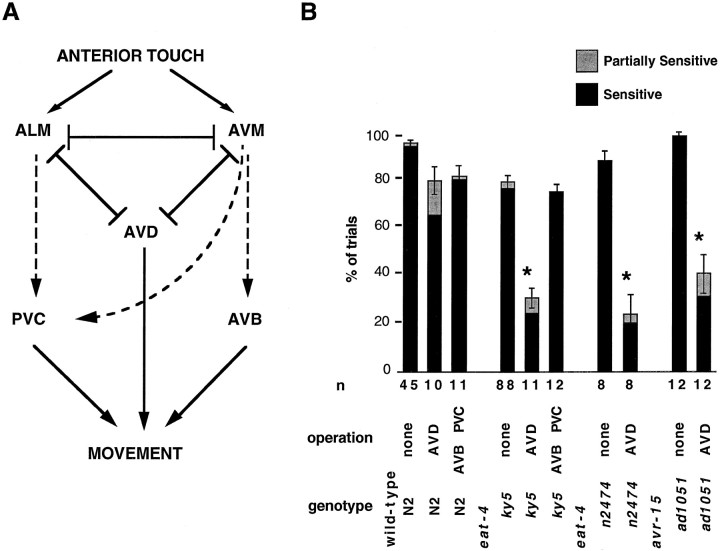
Fig. 4.
eat-4 function in the anterior touch cells. A, Schematic circuit diagram of the anterior touch response. The diagram is modified from Chalfie et al. (1985). The arrows represent chemical synapses, and the bars represent gap junctions. Dashed lines represent the chemical synapses affected byeat-4, as suggested by the data in B.B, Quantitation of the anterior touch response. For each gentle touch to the anterior body the animal’s response was scored as sensitive if backing occurred immediately, partially sensitive if backing occurred with a delay, and insensitive if backing did not occur within several seconds. The response of each animal was tested at least seven times, and the bars represent the average percentage of trials in which the animals responded as sensitive (black portion of the bar) or partially sensitive (gray portion of thebar). Error bars represent the SEM for the percentages of responses that were either sensitive or partially sensitive. Cases in which the behavior of the operated animals was significantly different from that of the mock-operated animals of the same genotype are indicated by an asterisk(p < 0.05); n, number of animals tested.

