
Figure 1.
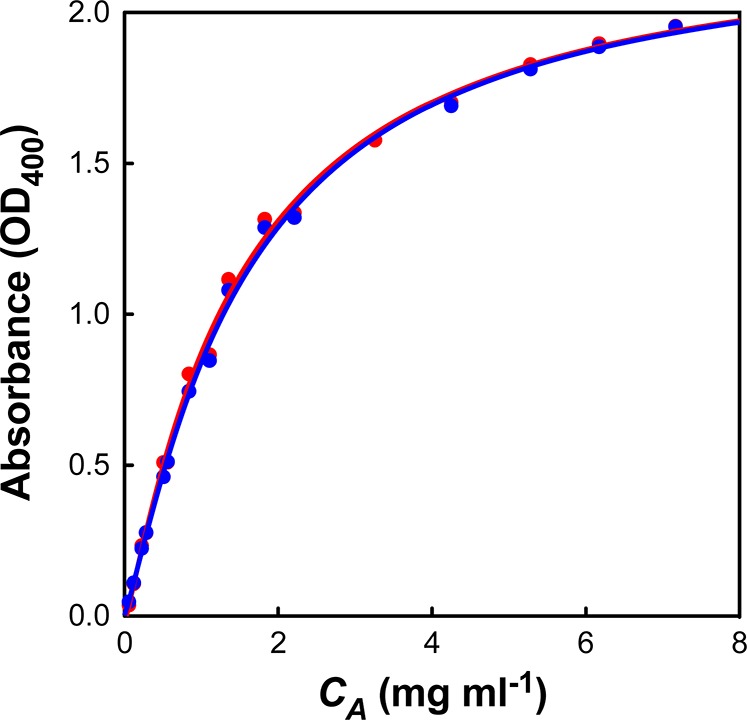
Calibration curve of turbidity (OD400) versus aggregate concentration (CA) derived from the stopped-flow instrument. Red and blue points represent two separate data sets. The curves were fit with the equation CA = a × OD400 + b × (OD400)c giving the parameters a = 1.047, b = 0.126, and c = 5.523. This equation was then used to convert all subsequent turbidity measurements into aggregate concentrations.