Figure 4.

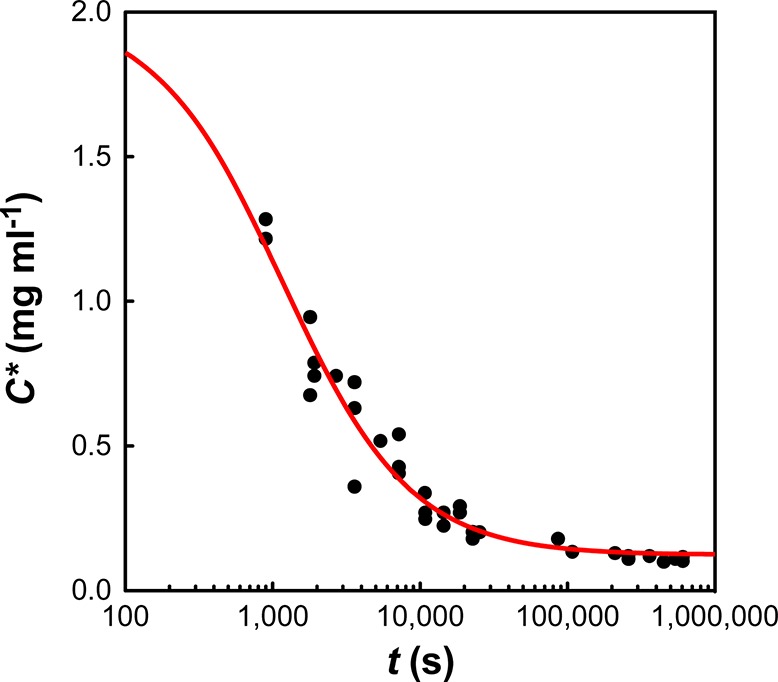
The concentration of soluble protein (C) remaining over an extended aggregation time course (1 week) for C0 = 2 mg mL–1. The red line shows a hyperbolic fit to the data with an apparent rate constant of 4.8 × 10⁻⁴ mg–1 mL s–1.

The concentration of soluble protein (C) remaining over an extended aggregation time course (1 week) for C0 = 2 mg mL–1. The red line shows a hyperbolic fit to the data with an apparent rate constant of 4.8 × 10⁻⁴ mg–1 mL s–1.