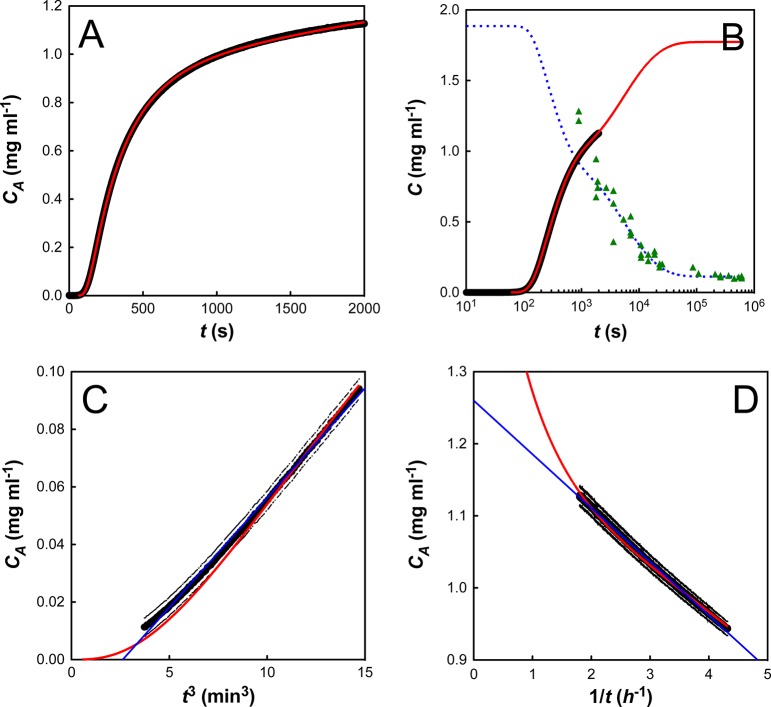
Figure 6.
Fit of the model for C0 = 1.89 mg mL–1. The concentration of aggregate (CA) is plotted in black (for clarity error bars are not plotted for every point), with model fits displayed in red. (A) Fit of stopped-flow data. (B) Concurrent fit of the stopped-flow data and the long time scale solubility results (data: green triangles; fit: blue dashed line). (C) Plot of CA vs t3. (D) Plot of CA vs 1/t. In C and D, thin blue lines are linear fits to the data (as described in the text).

