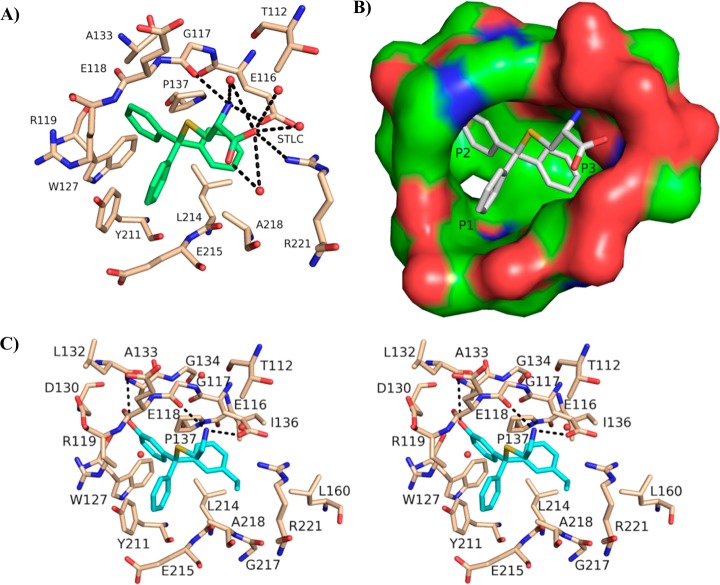
Figure 3.
(A) The Eg5–4 allosteric binding site, illustrating interactions with proximal (4 Å) protein residues.29 Hydrogen bonds are represented as dashed lines. (B) The Eg5–4 inhibitor-binding pocket with a solid surface illustrating the nomenclature for subpockets P1, P2, and P3. (C) Stereoplot of (R)-46 in the allosteric binding site. Hydrogen bonds between inhibitor (blue) and Eg5 residues (beige) are depicted by black broken lines. Coordinate and structure factor files for the Eg5–46 complex (PDB ID: 4BBG) were deposited at the PDB.

