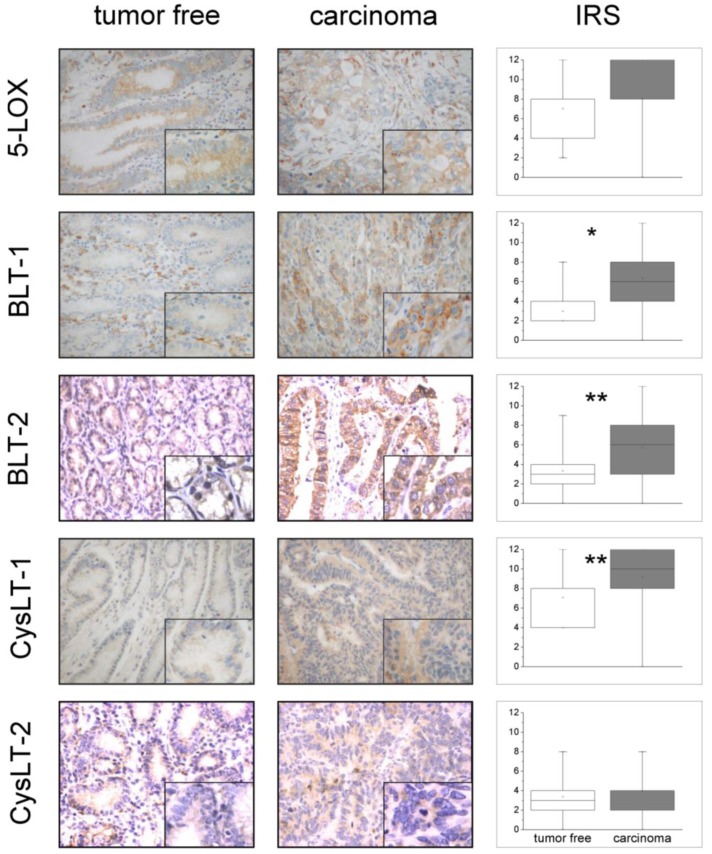
Figure 1.
Immunohistochemical (IHC) expression of 5-LOX, BLT-1, BLT-2, CysLT-1, CysLT-2 in GC and tumor-free gastric mucosa. On the left side of the figure are shown IHC staining patterns from tumor-free gastric mucosa and GC specimens, respectively. Each slide displays a representative section of the gastric surface epithelium at low (whole image) and high magnification (right lower corner). Signals illustrating 5-LOX, BLT-1, BLT-2, CysLT-1, CysLT-2 appear in brown (microscope: Nikon F200 camera, Nikon coolpix 990; 100×, 400×). On the right side of the figure is shown the IHC expression of 5-LOX and LT-receptors in the tumor-free gastric mucosa and GC, respectively. Values are presented as box plot graphics where each box plot shows the location of the median (marked line), mean (open square) and the 25th and 75th quartiles (inferior and superior limit of boxes). IRS: immunoreactive score. * denotes p < 0.01 (BLT-1), ** denotes p < 0.001 (BLT-2 and CysLT-1) (Mann-Whitney U-test).

