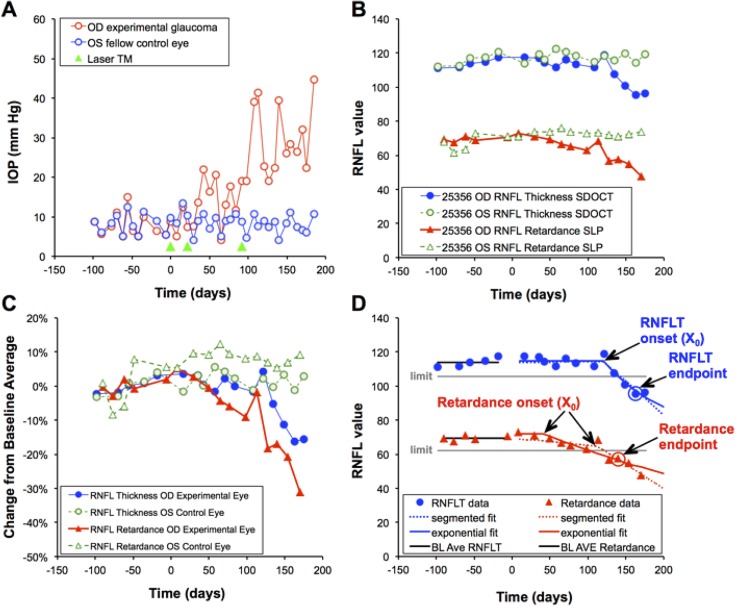
Figure 1.
Example of experimental time course for a single representative animal. (A) IOP versus time; green arrowheads indicate dates of laser photocoagulation to the trabecular meshwork (TM Laser). (B) Peripapillary measurements of RNFL thickness (circles, μm) and RNFL retardance (triangles, nm*1.67) measured over time in the experimental eye (filled symbols) and control eye (open symbols). (C) RNFL data (from [B]) are normalized to their respective baseline averages and replotted to better compare the relative time course of each parameter, which in this case shows that RNFL retardance declined before RNFL thickness in the experimental eye. (D) Results of the event analysis to determine endpoint and both forms of trend analysis to determine onset of progressive loss for the experimental eye of this animal. The lower limit of measurement noise (95% confidence limit) calculated by bootstrapping for all 82 study eyes is shown by the horizontal gray line relative to the baseline average for each RNFL parameter. The second consecutive observation below this limit represents the endpoint for each parameter. This eye reached endpoint by both RNFL thickness (163 days) and RNFL retardance (140 days). The results of segmented linear regression and exponential decay fits to determine the time of onset are also shown for each parameter by the dotted and solid curves, respectively. Onset for RNFL thickness in this eye was 121 days by both segmented and exponential fits (R2 = 0.89 and 0.92, respectively); onset for RNFL retardance was 113 days by segmented fit and 42 days by exponential fit (R2 = 0.89 and 0.92, respectively).

