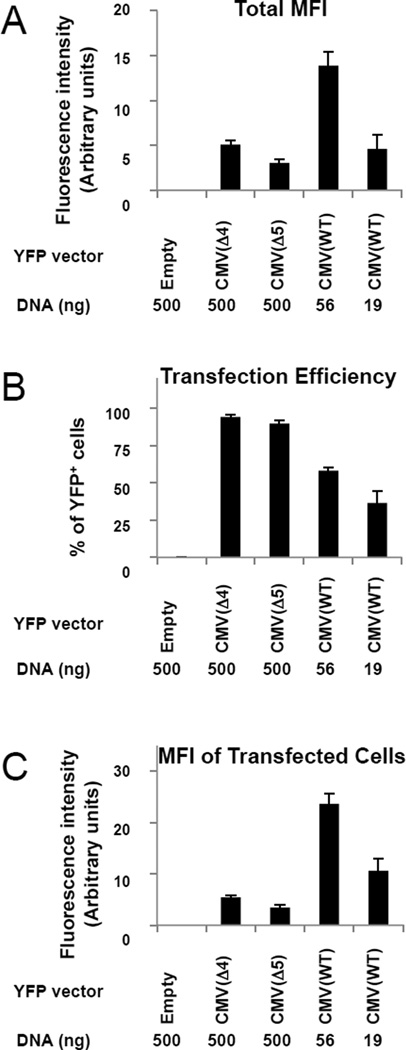
Figure 3. Comparisons of transfection efficiencies and protein expression levels for the pCMV(WT)-YFP, pCMV(Δ4)-YFP, and pCMV(Δ5)-YFP vectors.
(A) Total mean fluorescence intensity of YFP (MFI, in arbitrary units) for all cells in each of the cultures following transfection with 500 ng empty pCMV(WT)(negative control, lane 1), 500 ng pCMV(Δ4)-YFP (lane 2), 500 ng pCMV(Δ5)-YFP (lane 3), 56 ng pCMV(WT)-YFP (lane 4) or 19 ng pCMV(WT)-YFP (lane 5). The YFP expression vectors were created by PCR amplification of the yfp gene and subcloned into the KpnI/XhoI sites of the custom multiple cloning site of the pcDNA™3.1/myc-His(-)A expression vector. 293T cells were seeded (t=0, 2×10⁵ cells/well, 6-well plates) and transfected (t=24h) with the designated pCMV-YFP constructs adjusted to 500 ng total DNA with pCMV(WT) empty vector where necessary), 10 µl Lipofectamine 2000). At t=72h, cells were trypsinized and analyzed by flow cytometry. YFP-positive cells were scored using a control-transfected sample to set the negative background level (BD CellQuest™ Pro software). YFP intensity was determined after subtracting control-transfected samples (FL1). Values here and in panels B and C show the average of five independent repetitions with standard errors.
(B) Percentages of cells with detectable YFP fluorescence in each of the cultures described in part (A).
(C) Mean YFP fluorescence intensity (arbitrary units) for the subsets of cells that were transfected (as judged by detectable YFP expression) in each of the cultures described in part (A).

