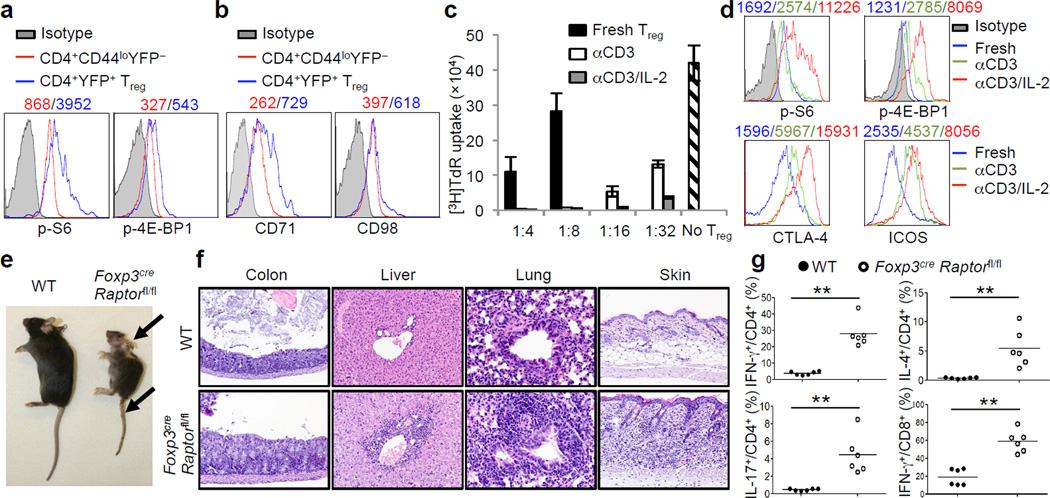
Figure 1.
mTORC1 signaling is constitutively active in Tregs and its disruption results in a fatal early-onset inflammatory disorder. a, Comparison of phosphorylation of S6 and 4E-BP1 between naïve T cells (CD4+CD44loFoxp3−) and Tregs (CD4+Foxp3+; from Foxp3YFP-Cre mice). b, Comparison of CD71 and CD98 expression between naïve T cells and Tregs. c, Tregs from C57BL/6J mice were activated with anti-CD3 or anti-CD3 and IL-2 for 3 days, washed and then used for in vitro suppression assays at multiple Treg vs Teff ratios; freshly isolated Tregs were included for comparison (shown only for 1:4 and 1:8 ratios). Error bars represent s.d. (n=3). d, Comparison of phosphorylation of S6 and 4E-BP1 and expression of CTLA-4 and ICOS between freshly isolated and pre-activated Tregs. e, Images of 42-day-old wild-type (WT) and Foxp3creRaptorfl/fl mice. Arrows indicate the scaly tail and ulceration of the body. f, Hematoxylin and eosin staining of colon, lung, liver and skin from 21-day-old wild-type and Foxp3creRaptorfl/fl mice. g, IFN-γ, IL-17 and IL-4 production in CD4+ and IFN-γ production in CD8+ cells from wild-type and Foxp3creRaptorfl/fl mice. P values are determined by Mann Whitney test. Mean fluorescent intensity (MFI) is presented above the plots of the relevant staining (a, b, d). Results represent 5 (a, g), 3 (b) and 2 (c-f) independent experiments.

