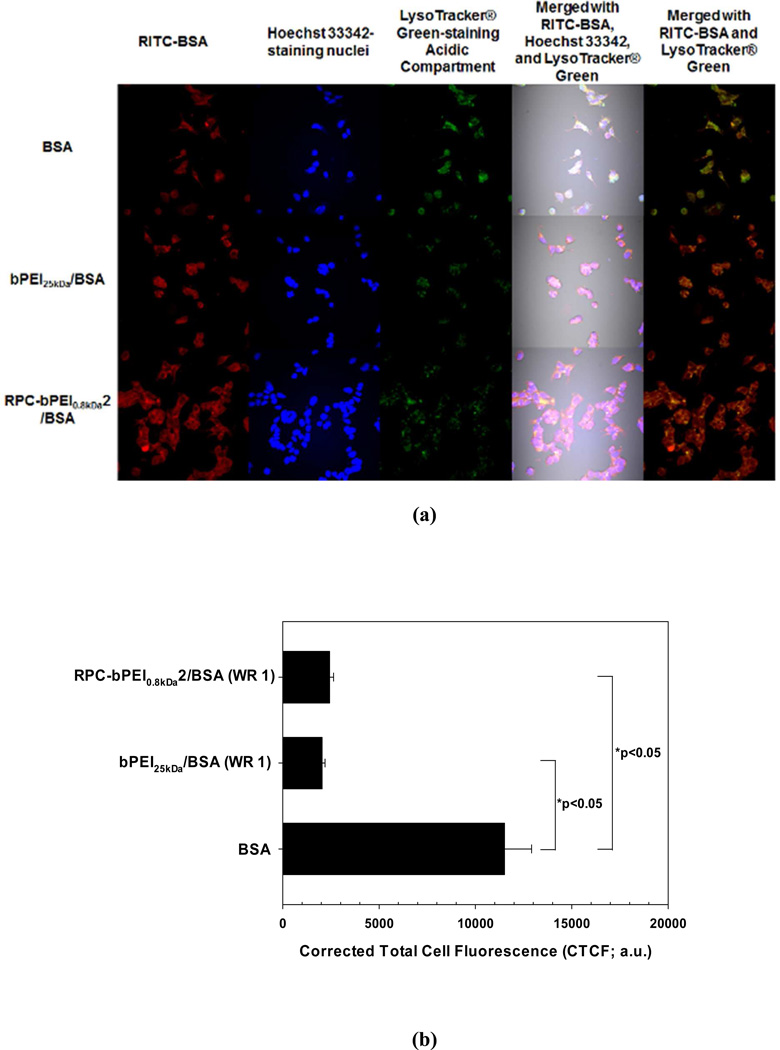
Figure 11.
(a) Accumulated confocal images for intracellular trafficking of the cationic polyelectrolyte/BSA complexes (WR 1) and BSA (10 ìg/mL) in MCF7 cells and (b) the intracellular endolysosome amount, as determined by CTCF, of the BSA- and polycation/BSA-treated cells (n ≥20, *p<0.05 by Kruskal-Wallis One Way Analysis of Variance on Ranks followed by post-hoc Dunn’s analysis). MCF7 cells (5×10⁵ cells) for studying uptake of the polycation/BSA complexes and free BSA were seeded in each well of a 6-well plate and were exposed to free BSA and the complexes for 4 hr. Free BSA was labeled with RITC (red). Acidic compartments and nuclei were stained with LysoTracker® Green (green) and Hoechst 33342 (blue), respectively.

