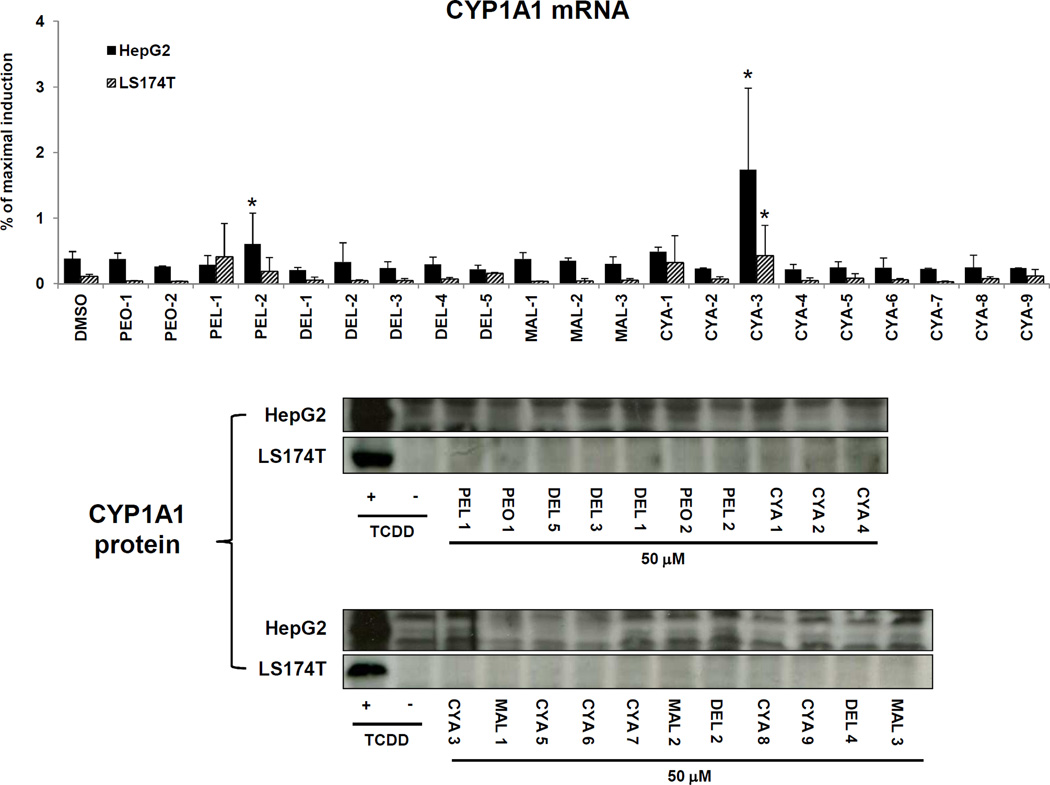
Figure 3. Effects of anthocyanins on the expression of CYP1A1 in HepG2 and LS174T cells.
Upper panel: Cells were incubated for 24 h with 21 anthocyanins (10 µM and 50 µM; i.e. PEO-1, PEO-2, PEL-1, PEL-2, DEL-1, DEL-2, DEL-3, DEL-4, DEL-5, MAL-1, MAL-2, MAL-3, CYA-1, CYA-2, CYA-3, CYA-4, CYA-5, CYA-6, CYA-7, CYA-8, CYA-9), TCDD (5 nM) and vehicle (DMSO; 0.1% v/v). Bar graph shows RT-PCR analyses (2 independent experiments) of CYP1A1 mRNA. The data are the mean from triplicate measurements and are expressed as a percentage of maximal induction attained in TCDD-treated cells. The data were normalized per GAPDH mRNA levels. * - value is significantly different from DMSO-treated cells (p < 0.05) as determined by the Student’s t-test. Lower panel: Cells were incubated for 48 h with 21 anthocyanins (10 µM and 50 µM; i.e. PEO-1, PEO-2, PEL-1, PEL-2, DEL-1, DEL-2, DEL-3, DEL-4, DEL-5, MAL-1, MAL-2, MAL-3, CYA-1, CYA-2, CYA-3, CYA-4, CYA-5, CYA-6, CYA-7, CYA-8, CYA-9), TCDD (5 nM) and vehicle (DMSO; 0.1% v/v). Western blots show a representative analysis of CYP1A1 protein. Similar profiles were observed in two independent experiments. As a loading control, the blots were probed to actin (data not shown).

