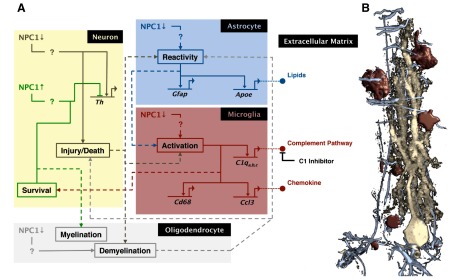
Fig. 4.

Development of a neurodegenerative interaction map. Cell-autonomous control of neuron rescue allows for the generation of a detailed cell-cell and molecular interaction network for the development of neurodegeneration in complex tissue. As studies add to the understanding of disease biology, a highly detailed neurodegenerative regulatory network will gradually be drawn, which ultimately could be used to determine the outcome of an intervention. (A) Illustrated here is a tentative roadmap of the pathology of cerebellar Purkinje neuron degeneration in NPC that is based on observed changes in cellular activity, gene expression pattern and protein localization in mice with conditional knockout and conditional rescue of NPC1 (Lopez et al., 2011; Yu et al., 2011; Lopez et al., 2012b; Lopez et al., 2012a; Yu and Lieberman, 2013). For simplicity, the current map only shows the following genes: Th (tyrosine hydroxylase), Gfap (glial fibrillary acidic protein), Apoe (apolipoprotein E), C1q (complement component 1, q subcomponent), Ccl3 (chemokines C–C motif ligand 3), and Cd68 (or macrosialin, a lysosomal membrane family protein specifically expressed by phagocytes). Solid lines represent possible intracellular pathways, and dotted lines depict intercellular interactions. The effect of NPC1 loss (brown lines) or NPC1 rescue (green lines) can be traced from the neuron. With the exception of brown and green lines, color of lines corresponds to processes in or from a particular cell type: gray, oligodendrocytes; red, microglia; blue, astrocyte. Question marks in the pathways emphasize the need to resolve the mechanisms of action further. The illustration was generated with the aid of BioTapestry software. (B) Colored regions correspond to the cells shown in a rendered confocal image of a Purkinje neuron from the cerebellar cortex of a diseased mouse. This image serves to emphasize the complexity of cell-cell interactions that occur during the disease pathology and therefore the need to assign pathways to the correct cell. Neuron is stained with Calbindin-D28K (yellow), astrocytes with GFAP (blue), and microglia with CD68 (red). Oligodendrocytes are not shown.
