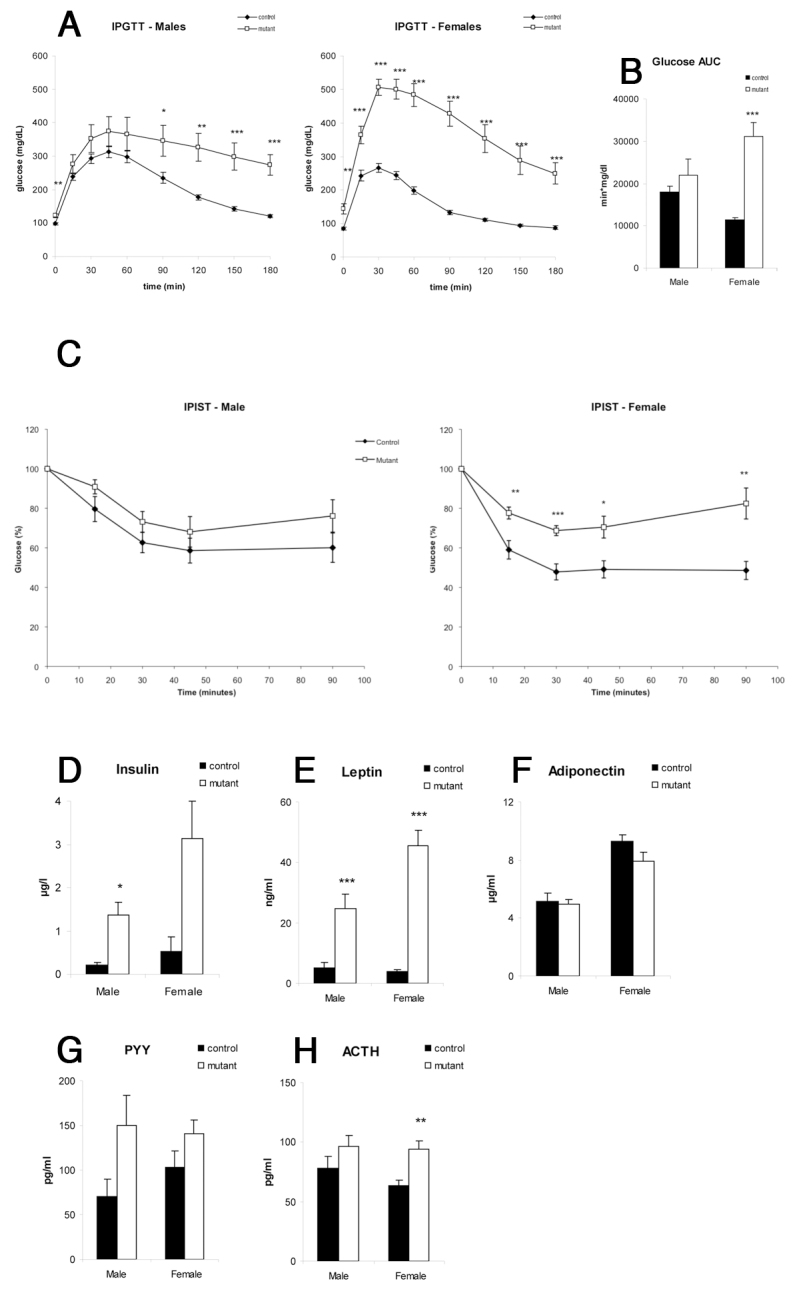
Fig. 4.

Nkx2.1iCre/+;Ngn3flox/flox mice display reduced glucose tolerance and insulin sensitivity, and show changes in blood hormone levels compared with controls. (A,B) Intraperitoneal glucose tolerance test (IPGTT). White squares, mutants; black squares, controls. Female mutant mice showed significantly higher glucose levels at all time points of the test, whereas, in male mutants, levels were not significantly higher immediately following injection; however, the glucose decrease following glycemic peak is slower (A). Female mutant mice showed significantly higher area under glucose curve (AUC) than controls (B). (C) Insulin sensitivity test (IPIST). Female mutant mice are significantly insulin resistant, whereas male mice do not reach significance. (D–H) Blood insulin, leptin, Pyy and Acth levels are increased in mutant mice (D,E,G,H), whereas adiponectin levels are unaffected (F). *P<0.05, **P<0.01, ***P<0.005.
