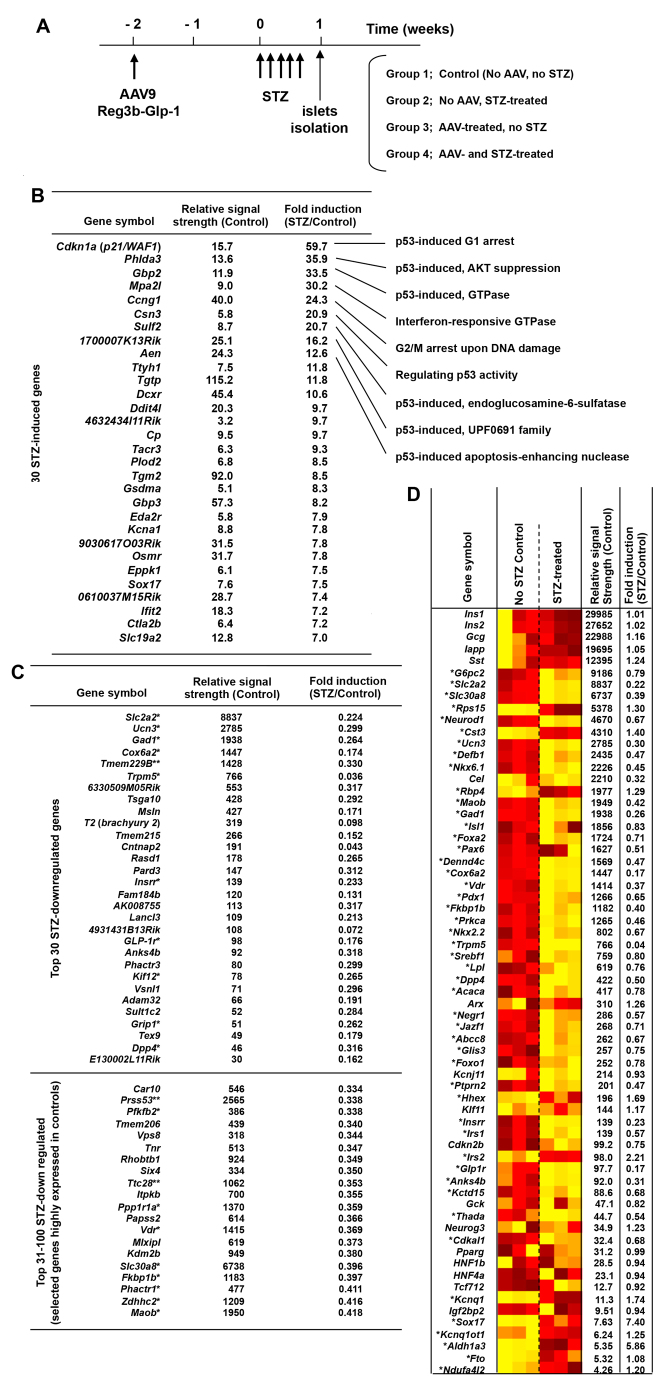
Fig. 5.
The global gene expression profiles of purified islets from mice that received STZ. (A) Schematic diagram of the experimental set-up. Mice were transduced with AAV9 mRIP–Reg3b–Glp-1 2 weeks before STZ administration. Islets were then isolated 7 days later (n=3/group). (B) Top 30 STZ-induced genes are indicated with fold increase over control. (C) Top 30 STZ downregulated genes. A single asterisk (*) indicates genes linked to diabetes or β-cell functions. A double asterisk (**) indicates genes with >1000 signal strengths, strongly suppressed by STZ, and with no known link with diabetes or β-cell functions. (D) Heatmap analysis of islet-specific genes for normal mice (control) and STZ treatments. A single asterisk (*) indicates genes linked to diabetes or β-cell functions. Gene expressions are compared based on varying degrees of yellow (lower) to red (higher). Within the control column of the heatmap, shades of yellow or red refer to normal expression levels, whereas in the STZ-treated column shades of yellow or red refer to lower or higher gene expressions compared with the controls.

