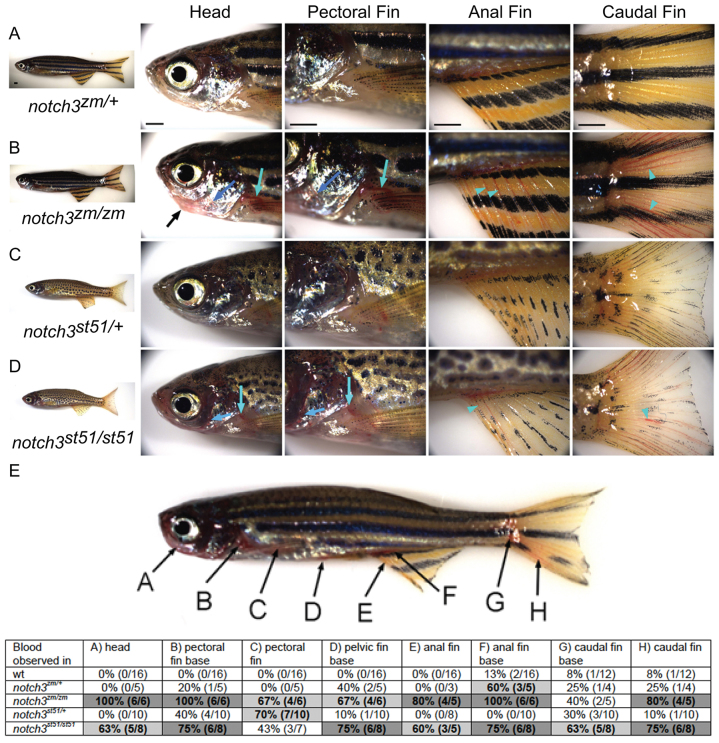
Fig. 4.
Vascular phenotype of notch3 mutants. (A–D) Lateral views of (A) notch3zm/+ heterozygotes, (B) notch3zm/zm mutants, (C) notch3st51/+ heterozygotes and (D) notch3st51/st51 mutants. (B) notch3zm/zm mutant adults show craniofacial defects (black arrow) and accumulation of blood (light and dark blue arrows and arrowheads) in the head, pectoral anal and caudal fins. (E) Quantification of the bleeding phenotypes. Degree of shading indicates penetrance of phenotype: white cell in the table indicates less than 50% of animals showed the phenotype, light gray indicates that 50–75% of individuals were affected, and dark gray denotes greater than 75% of animals had the phenotype.

