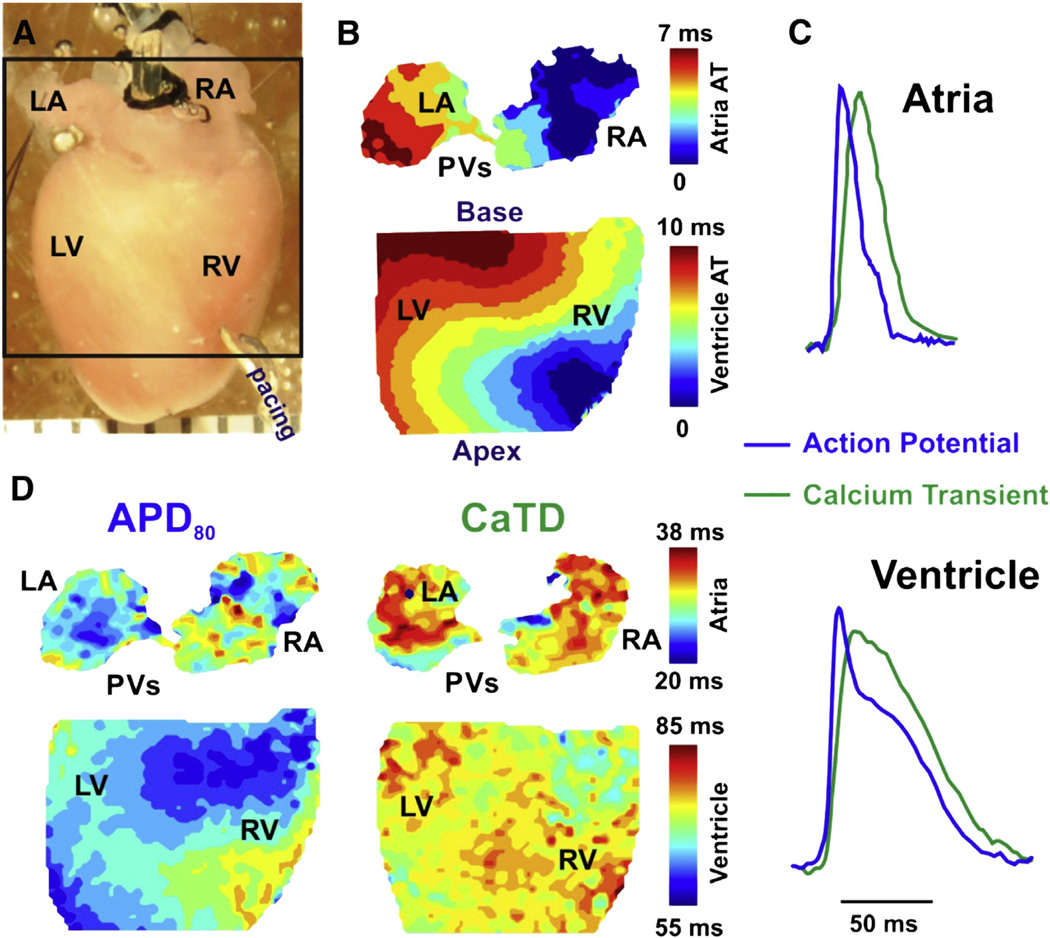
Fig. 1.
Experimental set up. A: The posterior surface of Langendorff-perfused mouse hearts was optically mapped during MI using voltage (RH237) and calcium (Rhod-2) sensitive fluorescent dyes with a CMOS Ultima-L camera. B: Activation maps were constructed from activation times (AT) determined from the dV/dtmax. C: Representative examples of superimposed optical recordings of AP (blue) and calcium transient (green) signals measured in mouse atria (top) and ventricle (bottom). D: Contour maps for the distribution of action potential duration (APD) and calcium transient duration (CaTD) at 80% return to baseline fluorescence are shown. (RA and LA – right and left atria; RV and LV – right and left ventricles; PVs – pulmonary veins). (For interpretation of the references to color in this figure legend, the reader is referred to the web version of this article.)

