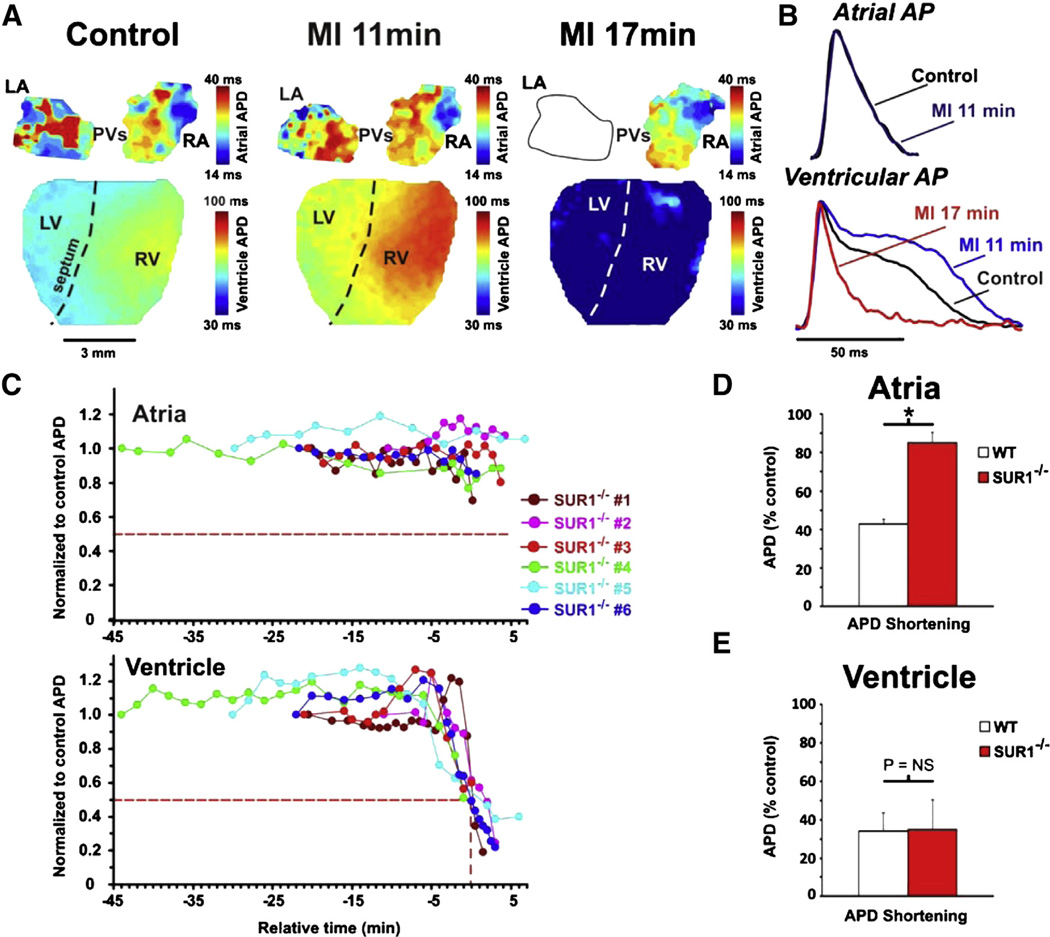
Fig. 3.
APD changes in SUR1−/− mice during MI. A: Representative APD maps for a SUR1−/− heart in control, 11 min MI, and 17 min MI. The ventricle responds in a similar manner to WT ventricles. The atria do not show shortening at 11 min MI. By 19 min, conduction to the LA was blocked but the RA still does not show APD shortening. B: Representative AP traces from atria (top) and ventricle (bottom) from control (black), 11 min MI (blue), and 17 min MI (red). Ventricles show a longer APD plateau at 11 min and a drastic shortening by 17 min. C: Representation of the atrial (top) and ventricular (bottom) APDs during MI from SUR1−/− hearts (n = 6) with relative time as in Fig. 2. The atria show no significant shortening relative to the control APD throughout MI but the ventricles display a similar biphasic effect as that seen in WT mice. D: Quantification of the relative APD shortening in WT and SUR1−/− atria during MI shows a clear shortening in WT but not SUR1−/− atria. E: Quantification of the relative APD shortening in WT and SUR1−/− ventricle during MI reveals no differences in the ventricles.

