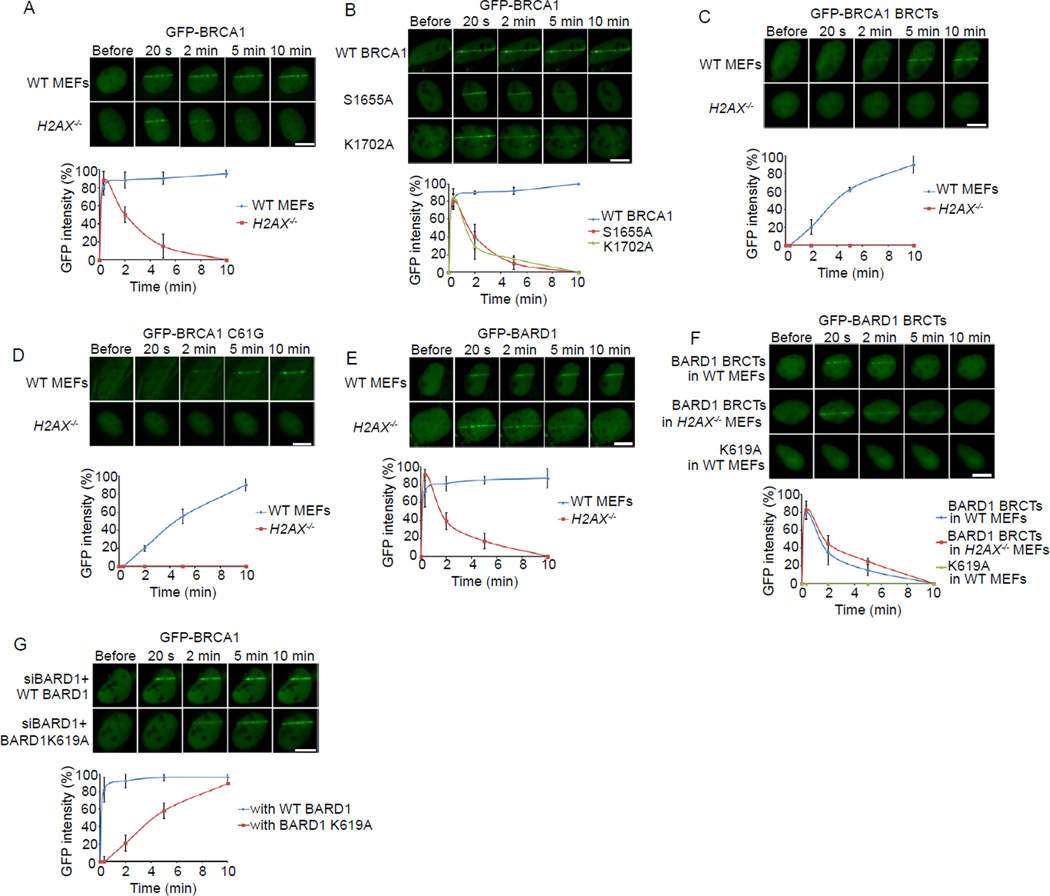
Figure 1. The recruitments of BRCA1 and BARD1 to DNA damage sites.
(A) The relocation kinetics of BRCA1 to DNA damage sites. GFP-BRCA1 was expressed in WT or H2AX−/− MEFs. The relocation kinetics was monitored in a time course following laser microirradiation (the same for below). (B) The relocation kinetics of the S1655A or K1702A mutants of BRCA1 to DNA damage sites. GFP-WT BRCA1, S1655A or K1702A mutants were expressed in U2OS cells. (C) The relocation kinetics of the BRCA1 BRCTs to DNA damage sites. The GFP-BRCA1 BRCTs was expressed in WT or H2AX−/− MEFs. (D) The relocation kinetics of the C61G mutant of BRCA1 to DNA damage sites. The GFP-BRCA1 C61G mutant was expressed in WT or H2AX−/− MEFs. (E) The relocation kinetics of BARD1 to DNA damage sites. GFP-BARD1 was expressed in WT or H2AX−/− MEFs. (F) The relocation kinetics of the BARD1 BRCTs and the K619A mutant to DNA damage sites. GFP-WT BARD1 BRCTs or the K619A mutant was expressed in WT or H2AX−/− MEFs. (G) The effect of the BARD1 K619A mutant on the recruitment of BRCA1 to DNA damage sites. U2OS cells stably expressing siRNA-resistant WT BARD1 or the K619A mutant were transfected with BARD1 siRNA to deplete endogenous BARD1. GFP-BRCA1 was expressed in these stable cell lines. GFP fluorescence at the laser line was converted into a numerical value (relative fluorescence intensity) using Axiovision software (version 4.5). Normalized fluorescent curves from 20 cells from three independent experiments were averaged. The error bars represent the standard deviation. Scale bar = 10 µm. See also Figure S1.

