
Figure 3. Comparison of the genes of P. cynomolgi, P. vivax and P. knowlesi.
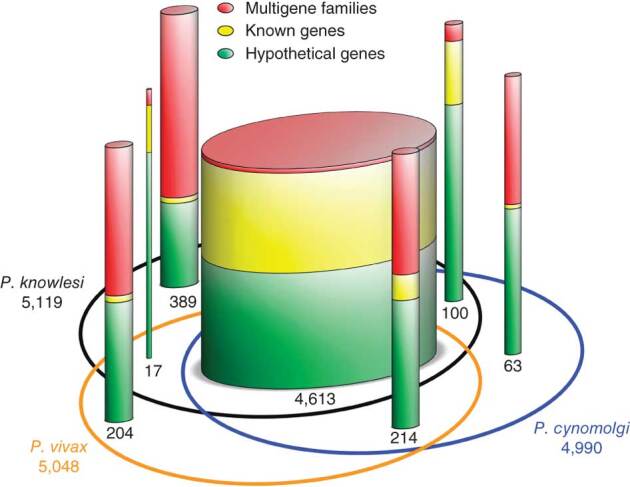
The Venn ellipses represent the three genomes, with the total number of genes assigned to the chromosomes indicated under the species name. Cylinders depict orthologous and non-orthologous genes between the three genomes, with the number of genes in each indicated and represented graphically by cylinder relative width. In each cylinder, genes are divided into three categories whose thickness is represented by colored bands proportional to category percentage.