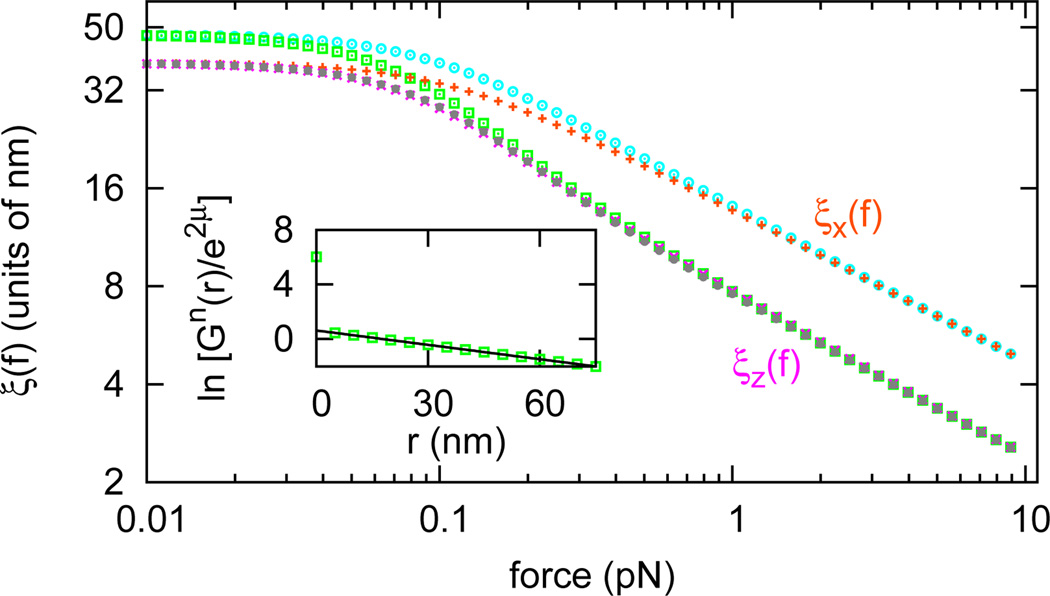
FIG. 3.
(color online) Protein occupation correlation length along DNA (bottom grey filled circles) in dilute protein solution (μ = −5, η = 0, γ = 0, a′ = 50). For reference, the tangent vector correlation lengths along DNA in the same solution (bottom pink crosses and top orange pluses) and those along a naked DNA (bottom green squares and top aqua circles) are shown. Inset shows ln[Gn̂(r)/e2μ] vs. distance at f = 0.1 pN (green squares) and a linear fit of it (black line).

