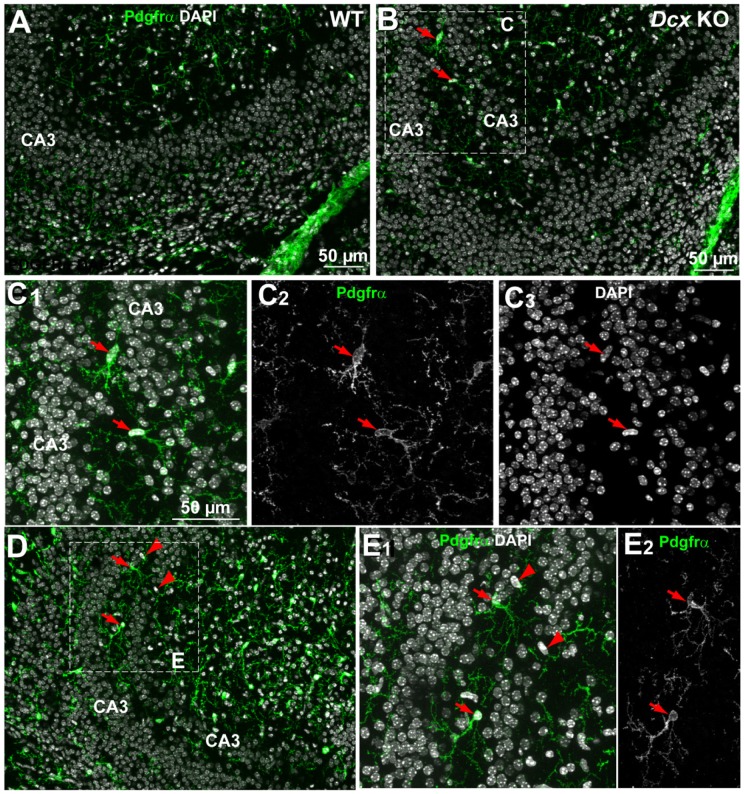
Figure 5. Oligodendrocyte precursor cells (OPCs) in WT and Dcx KO CA3 regions.
Immunoreactivity of Pdgfrα (to detect OPCs) observed in the CA3 region in P0 WT (A) and Dcx KO (B–E). The green fluorescent immunolabelling corresponds to OPCs whereas DAPI staining reveals cell nuclei (white). No Pdgfrα+ cells are revealed in the pyramidal cell layer in WT (A). In the KO, the red arrows (B–E) indicate the presence of Pdgfrα+ cells, characterized by ovoid nuclei intermingled among CA3 neurons. Arrowheads in D, E show other ovoid nuclei in the CA3 region of the Dcx KO that are Pdgfrα-negative. C and E are higher magnifications of the areas in the insets of B and D, respectively. Scale bars: 50 µm.

