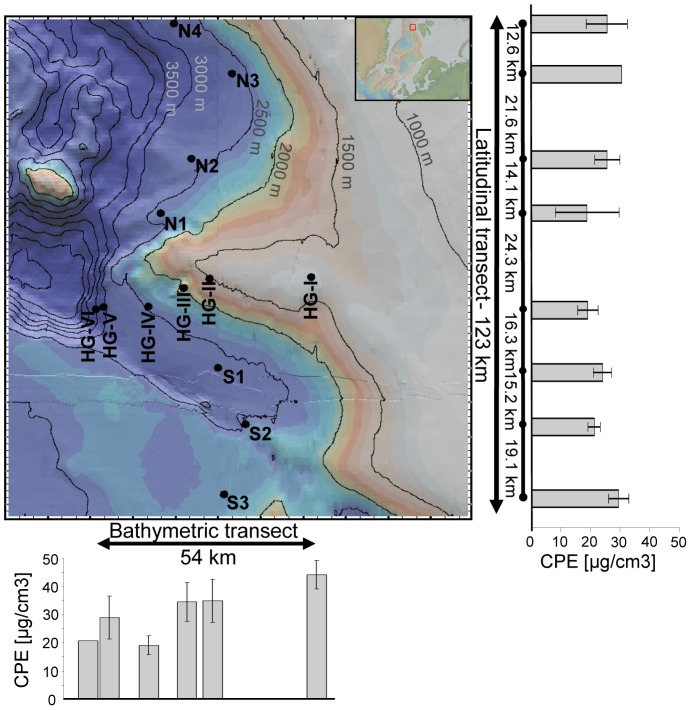
Figure 1. Location of sampling stations of the LTER site HAUSGARTEN and corresponding pigment concentrations (CPE).
Distances in km between sampling stations were calculated from latitude or longitude only for the latitudinal and bathymetric transect, respectively. Map created with GeoMapApp [70].

