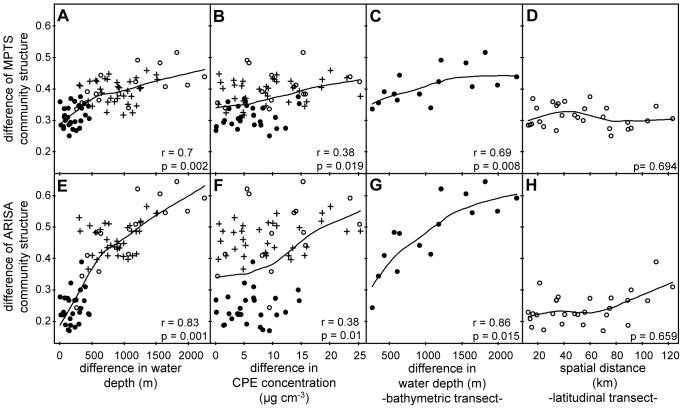
Figure 4. Changes in bacterial community structure with water depth and CPE concentrations and along spatial distance for the two transects.
The plots A, B, C and D are based on MPTS data, plots in E, F, G and H are based on ARISA data. Filled circles indicate comparisons of samples from the latitudinal transect, open circles indicate comparisons of samples from the bathymetric transect, crosses indicate comparisons across transects. C, D, G and H are based on a subset of 6 and 8 samples for the bathymetric and latitudinal transects, respectively. Mantel tests were used to assess the significance of Spearman’s correlation coefficients (r) based on 1000 permutations.

