
Figure 5. Non-metric multidimensional scaling (NMDS) plot of community data.
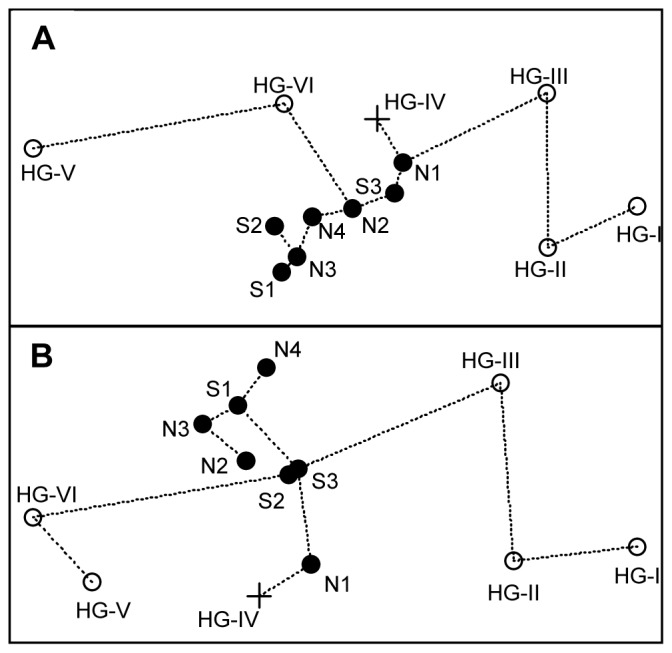
MPTS (A) and ARISA (B) data based on Bray-Curtis dissimilarity matrices. Open circles indicate stations from the bathymetric transect, filled circles indicate stations from the latitudinal transect and the crosses indicate the central station. Dotted lines show a minimum spanning tree connecting nearest neighbours. Stress values: 0.05 for A and 0.06 for B.