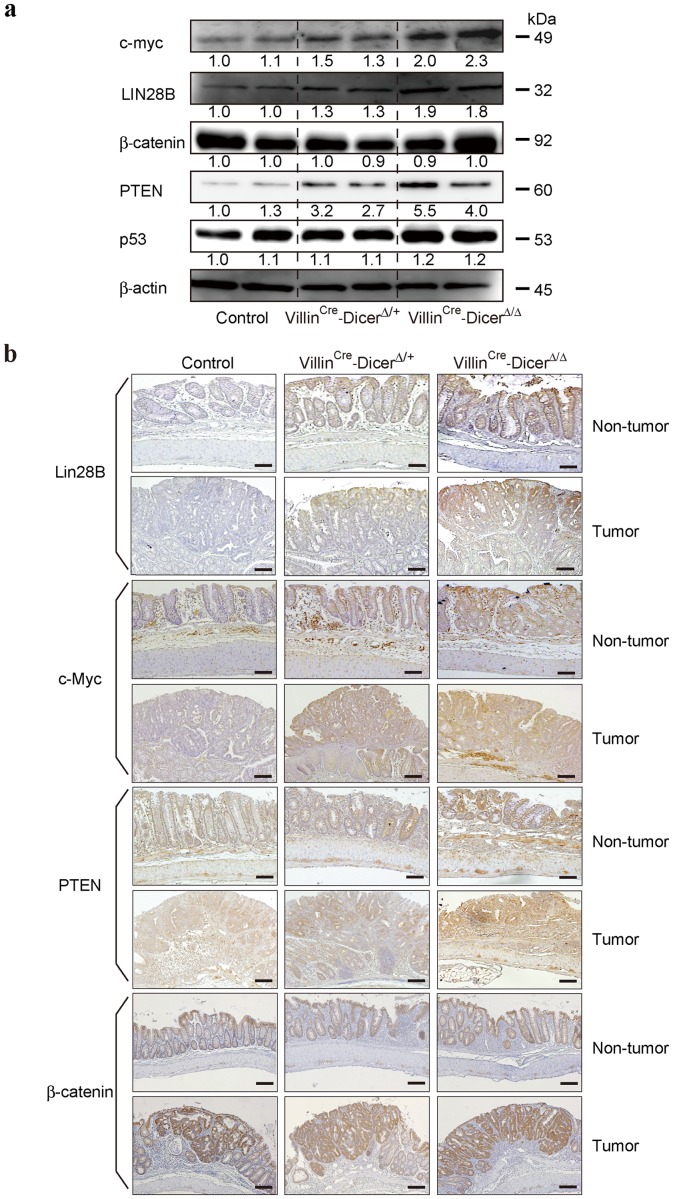
Figure 5. Expression levels of representative genes in colitis-associated tumors in Dicer1-mutant mice.
a, Western blotting for the indicated genes in isolated colon epithelial cells in bulk after induction of colitis-associated tumors. Representative images of two independent mouse sets are shown. The band intensities were quantitated and adjusted by the expression levels of β-actin. The calculated ratios are indicated below each panel after setting the value of the control mouse as 1.0. b, Immunohistochemical analyses of the indicated protein expression in the tumor and surrounding non-tumor tissue from control and Dicer1-mutant mice after induction of colitis-associated tumors. Scale bars = 200 μm. Representative images are shown. Similar results were obtained from four independent mice per group.

