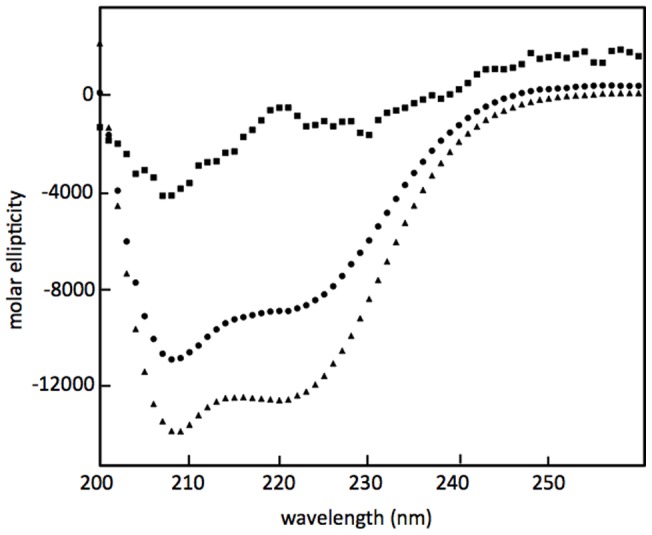
Figure 3. A) Far-UV CD spectra of SP-B (8–25,63–78) (triangles), SP-B (1–25,63–78) (circles) and SP-B (1–7) (squares) dissolved in SDS micelles.

Spectra were taken using a 1 mm path-length quartz cuvette from 200 nm to 260 nm at 25°C. Shown are single scans. Three additional spectra of each sample were acquired and the 4 scans averaged together before % secondary structure was extracted ( Table 2 ).
