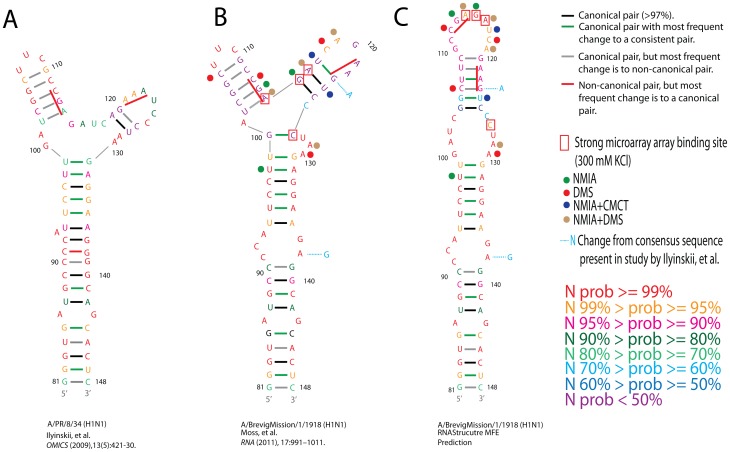
Figure 2. Structural models for nucleotides 81–148 of influenza A segment 8 (NS1/NEP).
Numbering begins at the start of the NS1 open reading frame (ORF). Structural model A comes from Ilyinskii, et al. [12] and the sequence is from strain A/PR/8/34 (H1N1), B is modeled [9] with RNAalifold [18], and C is the MFE prediction from RNAstructure [14], [15]. B and C have the consensus sequence for this region based on an alignment of 1017 unique sequences and can be found in many strains, including A/BrevigMission/1918 (H1N1), which caused the most deadly pandemic in history [16]. RNAstructure free energy predictions at 37°C for sequences and structures A, B, and C are −7.1, −8.2, and −12.0 kcal/mol, respectively [15]. These free energy predictions exclude the GC pair at 100/127 in structure B, because it is predicted not to form on the basis of thermodynamic parameters for secondary structure [14]. Tertiary interactions may allow this pair to form or, alternatively, a C127/G131 base pair to form closing a UAA triloop. UAA triloops are common [42], [43] and can form tertiary interactions [24], [44], [45]. Individual nucleotides are colored based on probabilities from RNAstructure partition function calculations as shown in the key [19]. Colors of lines between nucleotides indicate type of conservation of pairing (see tables in Figure S1). Strong modification sites for NMIA, CMCT, and DMS are indicated by colored-dots next to each reactive nucleotide. Red boxes indicate the center nucleotide of strongly binding iso-energetic microarray probes in 10 mM Tris-HCl, pH 7.0, 300 mM KCl, and 10 mM MgCl2. Probe 127 could bind strongly to site 91, but it binds stronger than probe 91, indicating that site 127 is a true binding site for probe 127. Medium binding sites are not shown, but are centered at nucleotides 91 and 128. Light blue nucleotides next to structures B and C indicate positions in which sequence A differs from the consensus sequence. Solid red bars indicate the codons that were changed to GCG by Ilyinskii, et al. and led to down-regulation of NS1 protein [12]. The chemical mapping data, particularly the strong reactivity of nucleotides 112 and 113, are consistent with structure C but not with structure B.

