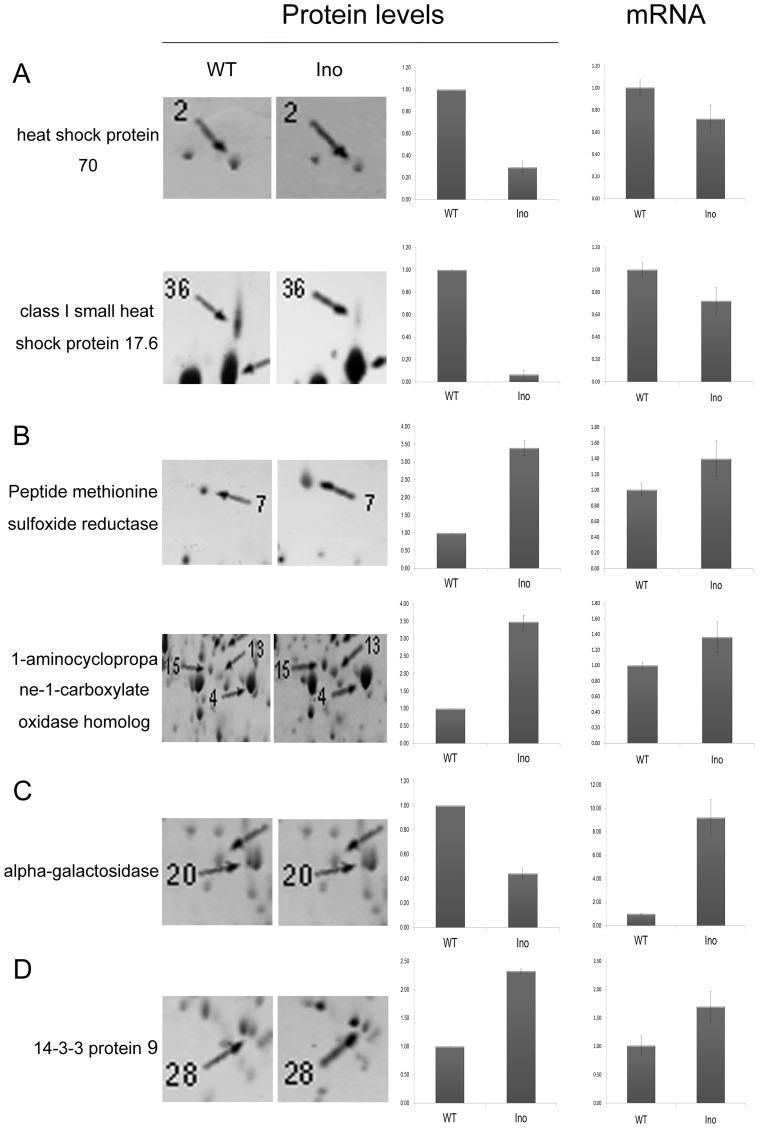
Figure 6. Comparison of gene expression profiles at protein and mRNA levels.
Differential protein expression between N-Ino and Ino was revealed by 2D gel electrophoresis. Histograms show the changes in protein abundance. The spot number on the 2D gels and the functional annotation for each protein are shown. The mRNA expression levels were measured by quantitative real-time PCR. The gene transcript levels are indicated as fold changes after normalization against the 18 S rRNA gene, followed by normalization against the N-Ino. The results for protein and mRNA expression are means±SE from three independent experiments.

