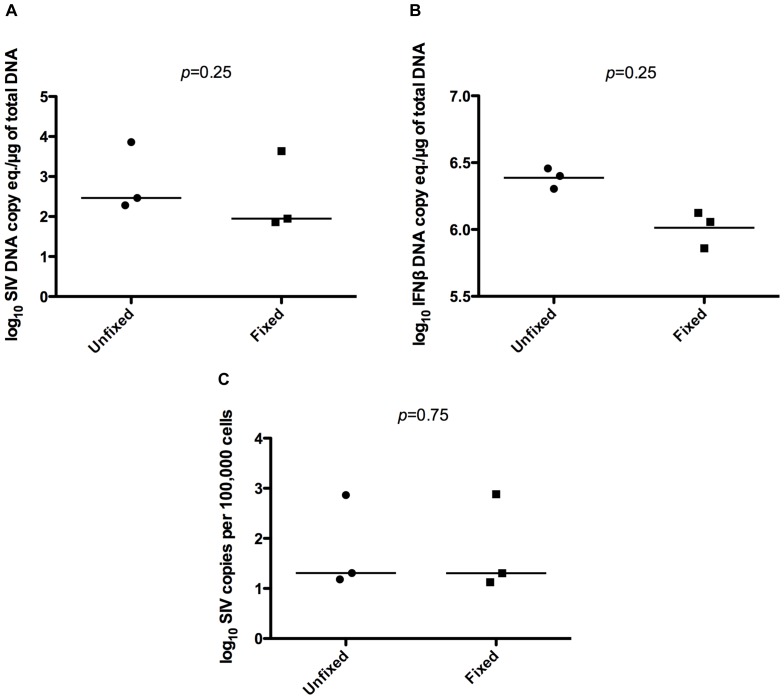
Figure 5. Comparison of SIV DNA quantitation by qPCR between unfixed and fixed cells.
SIV (A) and IFNβ (B) DNA copies per total DNA input were measured by qPCR in unfixed and fixed SIV-infected, pigtailed macaque PBMCs from three animals. Calculation of SIV copies per 100,000 cells for each sample was performed using respective IFNβ levels to normalize (C). Each point represents the average value of three technical replicates for one animal. Data were analyzed by Wilcoxon matched-pairs rank test.

