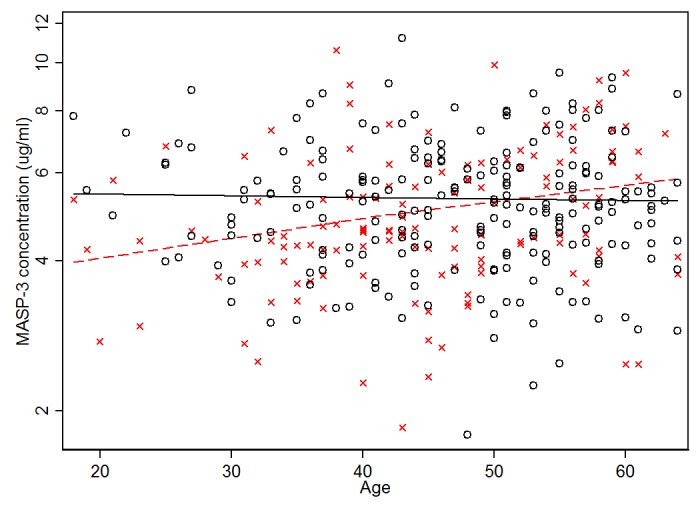
Figure 2. The relationship between age, gender, and MASP-3 concentration.

X = female, O = male. The dashed line indicated the best fitted line for females and the solid line for males.

X = female, O = male. The dashed line indicated the best fitted line for females and the solid line for males.