
Figure 2. The relationship between age, gender, and MASP-3 concentration.
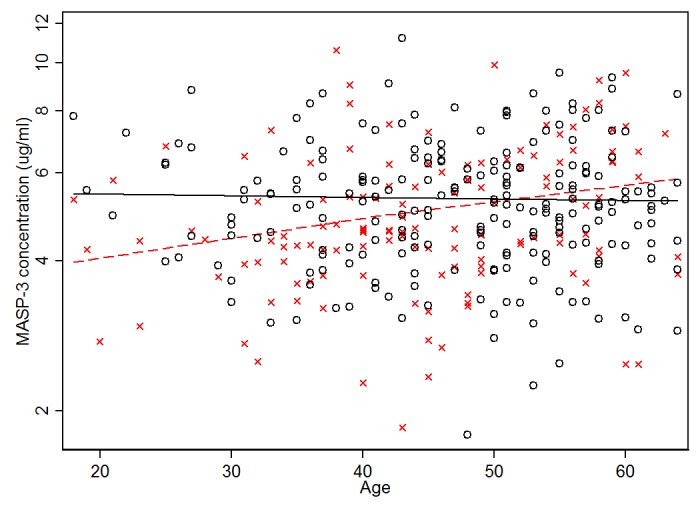
X = female, O = male. The dashed line indicated the best fitted line for females and the solid line for males.
Official websites use .gov
A
.gov website belongs to an official
government organization in the United States.
Secure .gov websites use HTTPS
A lock (
) or https:// means you've safely
connected to the .gov website. Share sensitive
information only on official, secure websites.
X = female, O = male. The dashed line indicated the best fitted line for females and the solid line for males.